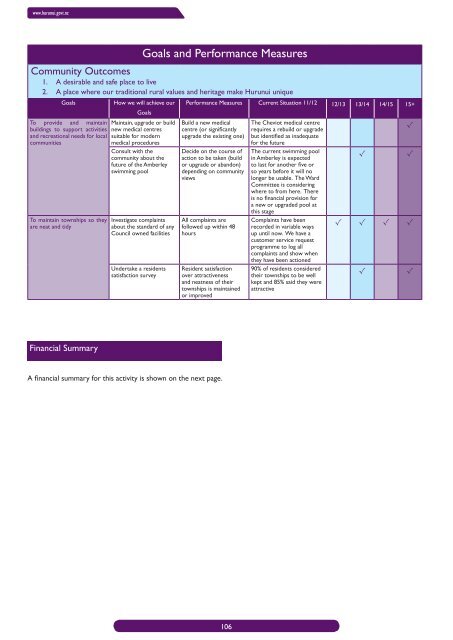
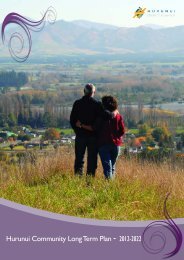
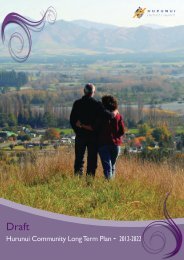
www.hurunui.govt.nz Goals and Performance Measures <strong>Community</strong> Outcomes 1. A desirable and safe place to live 2. A place where our traditional rural values and heritage make <strong>Hurunui</strong> unique Goals To provide and maintain buildings to support activities and recreational needs for local communities To maintain townships so they are neat and tidy How we will achieve our Goals Maintain, upgrade or build new medical centres suitable for modern medical procedures Consult with the community about the future of the Amberley swimming pool Investigate complaints about the standard of any <strong>Council</strong> owned facilities Undertake a residents satisfaction survey Performance Measures Current Situation 11/12 12/13 13/14 14/15 15+ Build a new medical centre (or significantly upgrade the existing one) Decide on the course of action to be taken (build or upgrade or abandon) depending on community views All complaints are followed up within 48 hours Resident satisfaction over attractiveness and neatness of their townships is maintained or improved The Cheviot medical centre requires a rebuild or upgrade but identified as inadequate for the future The current swimming pool in Amberley is expected to last for another five or so years before it will no longer be usable. The Ward Committee is considering where to from here. There is no financial provision for a new or upgraded pool at this stage Complaints have been recorded in variable ways up until now. We have a customer service request programme to log all complaints and show when they have been actioned 90% of residents considered their townships to be well kept and 85% said they were attractive √ √ √ √ √ √ √ √ √ Financial Summary A financial summary for this activity is shown on the next page. 106
<strong>Hurunui</strong> <strong>Community</strong> <strong>Long</strong> <strong>Term</strong> <strong>Plan</strong> <strong>2012</strong> - <strong>2022</strong> Property - Activity Financial Summary Annual <strong>Plan</strong> Year 1 Year 2 Year 3 Year 4 Year 5 Year 6 Year 7 Year 8 Year 9 Year 10 2011/<strong>2012</strong> <strong>2012</strong>/2013 2013/2014 2014/2015 2015/2016 2016/2017 2017/2018 2018/2019 2019/2020 2020/2021 2021/<strong>2022</strong> Operating Statement Operating Revenue <strong>District</strong> Wide Rates * 5,056 (45,358) (48,498) (52,863) (54,846) (56,270) (57,400) (59,202) (60,511) (62,646) (64,922) Targeted Rates 167,259 535,296 544,235 559,364 576,635 577,339 641,446 645,308 667,497 681,234 687,458 Other Income 398,690 400,800 413,345 425,930 439,437 453,906 466,812 479,998 495,188 511,862 528,615 Development Contributions 92,691 60,911 63,460 65,489 67,573 74,640 76,814 79,761 83,219 87,003 70,694 Total Operating Revenue 663,696 951,649 972,542 997,921 1,028,799 1,049,614 1,127,671 1,145,865 1,185,394 1,217,453 1,221,846 Operating Expenditure Employee Benefits 141,524 143,127 147,607 152,101 156,924 162,091 166,700 171,409 176,833 182,787 188,770 Direct Operating Expenditure 793,641 756,820 728,428 747,323 787,895 790,847 820,904 848,284 871,794 900,126 934,203 Internal Interest Paid 115,490 156,772 150,187 141,812 132,642 122,612 180,222 169,595 157,942 145,145 131,091 <strong>Council</strong> Overheads Expenditure 151,854 114,233 116,946 121,232 122,518 125,543 128,272 131,046 136,017 137,683 141,156 Depreciation 170,037 222,270 224,071 280,936 305,541 308,155 336,171 337,952 339,809 357,573 359,604 Total Operating Expenditure 1,372,546 1,393,222 1,367,238 1,443,403 1,505,520 1,509,249 1,632,268 1,658,287 1,682,395 1,723,314 1,754,825 Operating Surplus (Deficit) (708,850) (441,573) (394,696) (445,482) (476,721) (459,635) (504,597) (512,422) (497,002) (505,861) (532,979) Capital Statement Capital Expenditure Rental Property 20,000 0 31,176 0 0 0 0 0 0 0 0 Public Toilets 0 0 0 0 0 103,563 0 0 0 0 0 Medical Centres 0 0 0 0 0 1,150,700 0 0 0 0 0 Halls 15,000 25,000 2,078 206,170 2,221 2,301 2,389 2,486 2,592 2,710 2,835 Pools 0 2,000 2,078 2,148 2,221 2,301 2,389 2,486 2,592 2,710 2,835 Township Maintenance 11,637 88,500 26,500 20,939 20,548 21,288 34,043 21,779 255,940 25,069 26,222 Total Capital Expenditure 46,637 115,500 61,832 229,256 24,991 1,280,154 38,821 26,751 261,124 30,490 31,892 Funds Required Operating Deficit 708,850 441,573 394,696 445,482 476,721 459,635 504,597 512,422 497,002 505,861 532,979 Capital Expenditure 46,637 115,500 61,832 229,256 24,991 1,280,154 38,821 26,751 261,124 30,490 31,892 Transfer to Special Funds 70,040 46,842 48,609 50,378 51,941 54,008 55,527 57,492 59,967 62,769 51,242 Transfer to General <strong>Council</strong> Reserves 72,060 81,825 70,805 86,710 88,621 77,878 96,163 97,945 99,910 105,020 107,305 Repayment of Internal Loans from Operating Income 96,275 97,719 121,146 130,750 141,353 157,247 146,300 158,477 171,627 185,796 195,231 993,862 783,459 697,089 942,577 783,627 2,028,921 841,408 853,086 1,089,629 889,936 918,648 Funded by Transfer from Hanmer Springs Thermal Reserve 355,401 395,953 365,540 377,741 398,142 400,218 411,160 433,147 433,624 447,155 473,019 Non Cash Expenditure - Depreciation 170,037 222,270 224,071 280,936 305,541 308,155 336,171 337,952 339,809 357,573 359,604 Transfer from General <strong>Council</strong> Reserves 0 0 22,585 0 0 88,786 0 0 0 0 0 Transfer from Special Funds 36,000 0 0 0 0 0 0 0 0 0 0 Capital Expenditure funded through Internal Loans 432,424 165,236 84,892 283,900 79,944 1,231,762 94,077 81,987 316,196 85,208 86,026 993,862 783,459 697,089 942,577 783,627 2,028,921 841,408 853,086 1,089,629 889,936 918,648 * Surpluses from Other Property and Residential Housing is used to offset the <strong>District</strong> Wide Rates H:\<strong>Long</strong> <strong>Term</strong> <strong>Plan</strong> Workings\<strong>Hurunui</strong> <strong>District</strong> <strong>Council</strong> LTP Budgets <strong>2012</strong>-<strong>2022</strong> - Post Submissions.xls 31/05/<strong>2012</strong> 9:34 a.m. 107