Long Term Community Plan 2012-2022 - Hurunui District Council
Long Term Community Plan 2012-2022 - Hurunui District Council
Long Term Community Plan 2012-2022 - Hurunui District Council

You also want an ePaper? Increase the reach of your titles
YUMPU automatically turns print PDFs into web optimized ePapers that Google loves.
www.hurunui.govt.nz<br />
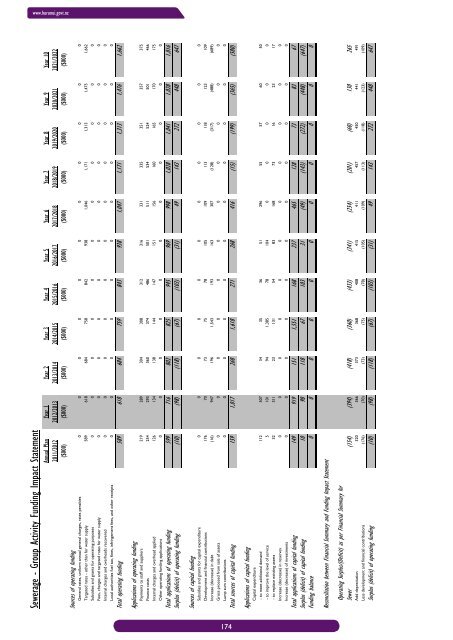
Sewerage - Group Activity Funding Impact Statement<br />
Annual <strong>Plan</strong> Year 1 Year 2 Year 3 Year 4 Year 5 Year 6 Year 7 Year 8 Year 9 Year 10<br />
2011/<strong>2012</strong> <strong>2012</strong>/2013 2013/2014 2014/2015 2015/2016 2016/2017 2017/2018 2018/2019 2019/2020 2020/2021 2021/<strong>2022</strong><br />
($000) ($000) ($000) ($000) ($000) ($000) ($000) ($000) ($000) ($000) ($000)<br />
Sources of operating funding<br />
General rates, uniform annual general charges, rates penalties 0 0 0 0 0 0 0 0 0 0 0<br />
Targeted rates - other than for water supply 589 618 684 758 842 938 1,046 1,171 1,313 1,475 1,662<br />
Subsidies and grants for operating purposes 0 0 0 0 0 0 0 0 0 0 0<br />
Fees, charges and targeted rates for water supply 0 0 0 0 0 0 0 0 0 0 0<br />
Internal charges and overheads recovered 0 0 0 0 0 0 0 0 0 0 0<br />
Local authorities fuel tax, fines, infringement fees, and other receipts 0 0 0 0 0 0 0 0 0 0 0<br />
Total operating funding 589 618 684 759 843 938 1,047 1,171 1,313 1,476 1,662<br />
Applications of operating funding<br />
Payments to staff and suppliers 219 289 304 308 312 316 331 335 351 357 375<br />
Finance costs 254 293 360 374 486 501 511 534 524 501 466<br />
Internal charges and overhead applied 126 134 138 144 147 151 156 160 165 170 175<br />
Other operating funding applications 0 0 0 0 0 0 0 0 0 0 0<br />
Total applications of operating funding 599 716 802 825 945 969 998 1,028 1,041 1,028 1,016<br />
Surplus (deficit) of operating funding (10) (98) (118) (67) (103) (31) 49 143 272 448 647<br />
Sources of capital funding<br />
Subsidies and grants for capital expenditure 0 0 0 0 0 0 0 0 0 0 0<br />
Development and financial contributions 176 70 73 75 78 105 109 113 118 123 109<br />
Increase (decrease) in debt (16) 947 196 1,543 193 163 307 (128) (317) (488) (689)<br />
Gross proceed from sale of assets 0 0 0 0 0 0 0 0 0 0 0<br />
Lump sum contributions 0 0 0 0 0 0 0 0 0 0 0<br />
Total sources of capital funding 159 1,017 268 1,618 271 268 416 (15) (199) (365) (580)<br />
Applications of capital funding<br />
Capital expenditure<br />
- to meet additional demand 112 507 34 35 36 51 296 55 57 60 50<br />
- to improve the level of service 5 101 94 1,385 78 104 0 0 0 0 0<br />
- to replace existing assets 32 311 23 131 54 83 168 73 16 23 17<br />
Increase (decrease) in reserves 0 0 0 0 0 0 0 0 0 0 0<br />
Increase (decrease) of investments 0 0 0 0 0 0 0 0 0 0 0<br />
Total applications of capital funding 149 919 151 1,551 168 237 465 128 73 83 67<br />
Surplus (deficit) of capital funding 10 98 118 67 103 31 (49) (143) (272) (448) (647)<br />
Funding balance 0 0 0 0 0 0 0 0 0 0 0<br />
Reconciliation between Financial Summary and Funding Impact Statement<br />
Operating Surplus/(Deficit) as per Financial Summary for<br />
Sewer (154) (394) (418) (360) (433) (341) (254) (201) (60) 130 265<br />
Add depreciation 320 366 373 368 408 415 411 457 450 441 491<br />
Less development and financial contributions (176) (70) (73) (75) (78) (105) (109) (113) (118) (123) (109)<br />
Surplus (deficit) of operating funding (10) (98) (118) (67) (103) (31) 49 143 272 448 647<br />
H:\<strong>Long</strong> <strong>Term</strong> <strong>Plan</strong> Workings\<strong>Hurunui</strong> <strong>District</strong> <strong>Council</strong> LTP Budgets <strong>2012</strong>-<strong>2022</strong> - Post Submissions.xls 31/05/<strong>2012</strong> 9:39 a.m.<br />
174