Long Term Community Plan 2012-2022 - Hurunui District Council
Long Term Community Plan 2012-2022 - Hurunui District Council
Long Term Community Plan 2012-2022 - Hurunui District Council

Create successful ePaper yourself
Turn your PDF publications into a flip-book with our unique Google optimized e-Paper software.
<strong>Hurunui</strong> <strong>Community</strong> <strong>Long</strong> <strong>Term</strong> <strong>Plan</strong> <strong>2012</strong> - <strong>2022</strong><br />
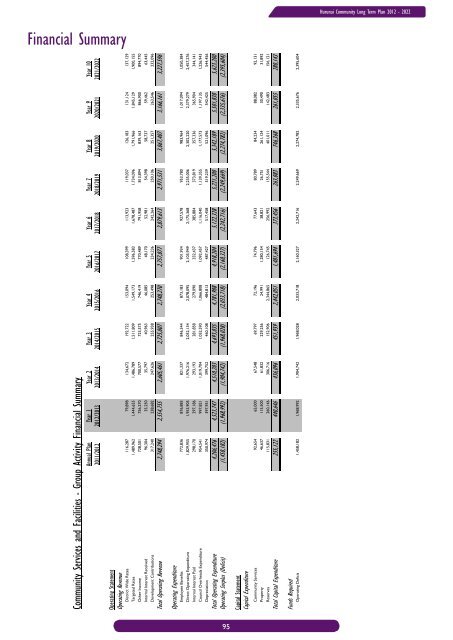
Financial Summary<br />
<strong>Community</strong> Services and Facilities - Group Activity Financial Summary<br />
Annual <strong>Plan</strong> Year 1 Year 2 Year 3 Year 4 Year 5 Year 6 Year 7 Year 8 Year 9 Year 10<br />
2011/<strong>2012</strong> <strong>2012</strong>/2013 2013/2014 2014/2015 2015/2016 2016/2017 2017/2018 2018/2019 2019/2020 2020/2021 2021/<strong>2022</strong><br />
Operating Statement<br />
Operating Revenue<br />
<strong>District</strong> Wide Rates 116,287 79,898 134,672 192,722 153,094 108,399 113,923 119,037 126,183 131,124 137,129<br />
Targeted Rates 1,489,962 1,444,655 1,486,789 1,511,809 1,549,173 1,596,583 1,678,487 1,734,096 1,791,966 1,845,129 1,900,155<br />
Other Income 728,501 756,270 700,577 723,575 746,419 770,489 791,958 813,894 839,163 866,900 894,770<br />
Internal Interest Received 96,304 35,250 35,797 40,963 46,085 48,170 52,981 54,398 58,737 59,462 63,445<br />
Development Contributions 317,240 238,682 247,626 255,938 253,498 234,236 242,264 250,106 251,357 263,546 232,096<br />
Total Operating Revenue 2,748,294 2,554,755 2,605,461 2,725,007 2,748,270 2,757,877 2,879,613 2,971,531 3,067,407 3,166,161 3,227,596<br />
Operating Expenditure<br />
Employee Benefits 772,836 876,883 821,337 846,344 873,183 901,934 927,578 953,780 983,964 1,017,094 1,050,384<br />
Direct Operating Expenditure 1,829,955 1,953,905 1,976,216 2,052,134 2,078,095 2,103,949 2,175,368 2,235,006 2,302,220 2,379,279 2,457,276<br />
Internal Interest Paid 298,170 297,186 293,193 281,858 279,090 332,437 385,884 373,819 357,336 365,904 344,141<br />
<strong>Council</strong> Overheads Expenditure 954,541 997,821 1,019,704 1,052,590 1,066,808 1,092,457 1,116,040 1,139,355 1,177,573 1,197,135 1,226,943<br />
Depreciation 350,974 397,951 399,752 460,108 484,813 487,427 517,458 519,239 521,096 542,425 544,456<br />
Total Operating Expenditure 4,206,476 4,523,747 4,510,203 4,693,035 4,781,988 4,918,204 5,122,328 5,221,200 5,342,189 5,501,838 5,623,200<br />
Operating Surplus (Deficit) (1,458,182) (1,968,992) (1,904,742) (1,968,028) (2,033,718) (2,160,327) (2,242,716) (2,249,669) (2,274,782) (2,335,676) (2,395,604)<br />
Capital Statement<br />
Capital Expenditure<br />
<strong>Community</strong> Services 92,654 65,000 67,548 69,797 72,196 74,796 77,643 80,789 84,234 88,082 92,131<br />
Property 46,637 115,500 61,832 229,256 24,991 1,280,154 38,821 26,751 261,124 30,490 31,892<br />
Reserves 115,831 260,146 306,716 152,906 2,344,865 126,745 256,992 155,544 401,011 142,483 156,121<br />
Total Capital Expenditure 255,122 440,646 436,096 451,959 2,442,051 1,481,694 373,456 263,083 746,368 261,055 280,143<br />
Funds Required<br />
Operating Deficit 1,458,182 1,968,992 1,904,742 1,968,028 2,033,718 2,160,327 2,242,716 2,249,669 2,274,782 2,335,676 2,395,604<br />
Capital Expenditure 255,122 440,646 436,096 451,959 2,442,051 1,481,694 373,456 263,083 746,368 261,055 280,143<br />
Transfer to Special Funds 341,814 199,265 231,358 237,120 248,751 232,374 236,254 248,506 255,204 240,990 216,298<br />
Transfer to General <strong>Council</strong> Reserves 145,013 154,805 143,785 159,691 161,603 150,859 169,146 170,928 172,892 178,004 180,288<br />
Repayment of Internal Loans from Operating Income 1,052,455 295,358 344,188 308,274 318,038 334,388 331,140 381,390 647,741 422,848 470,177<br />
3,252,586 3,059,065 3,060,170 3,125,072 5,204,161 4,359,643 3,352,711 3,313,576 4,096,987 3,438,572 3,542,511<br />
Funded by<br />
Transfer from Hanmer Springs Thermal Reserve 1,977,146 2,128,166 2,142,035 2,161,289 2,219,254 2,306,761 2,362,035 2,425,037 2,480,892 2,547,375 2,625,468<br />
Non Cash Expenditure - Depreciation 350,974 397,951 399,752 460,108 484,813 487,427 517,458 519,239 521,096 542,425 544,456<br />
Transfer from General <strong>Council</strong> Reserves 99,808 83,285 220,033 75,166 77,749 169,335 83,615 87,003 90,713 94,857 99,218<br />
Transfer from Special Funds 107,646 140,646 83,807 86,598 1,738,963 92,799 203,837 100,235 342,786 109,283 114,308<br />
Capital Expenditure funded through Internal Loans 717,012 309,017 214,542 341,911 683,383 1,303,320 185,765 182,061 661,499 144,632 159,060<br />
3,252,586 3,059,065 3,060,170 3,125,072 5,204,162 4,359,643 3,352,711 3,313,575 4,096,987 3,438,572 3,542,511<br />
95