The international economics of resources and resource ... - Index of
The international economics of resources and resource ... - Index of
The international economics of resources and resource ... - Index of

You also want an ePaper? Increase the reach of your titles
YUMPU automatically turns print PDFs into web optimized ePapers that Google loves.
Eco-innovation for environmental sustainability 279<br />
4.2 Eco-industries’ diffusion <strong>and</strong> cost-reduction<br />
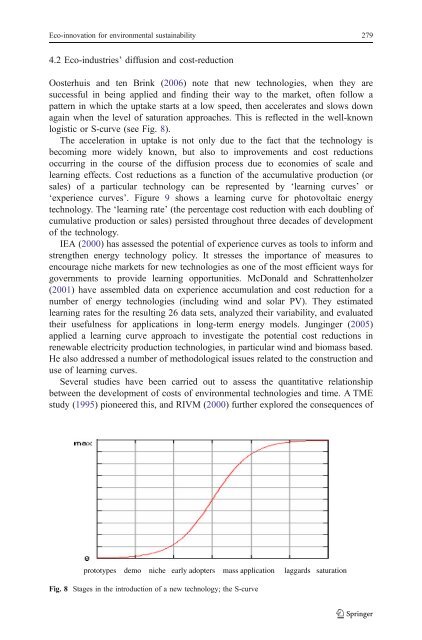
Oosterhuis <strong>and</strong> ten Brink (2006) note that new technologies, when they are<br />
successful in being applied <strong>and</strong> finding their way to the market, <strong>of</strong>ten follow a<br />
pattern in which the uptake starts at a low speed, then accelerates <strong>and</strong> slows down<br />
again when the level <strong>of</strong> saturation approaches. This is reflected in the well-known<br />
logistic or S-curve (see Fig. 8).<br />
<strong>The</strong> acceleration in uptake is not only due to the fact that the technology is<br />
becoming more widely known, but also to improvements <strong>and</strong> cost reductions<br />
occurring in the course <strong>of</strong> the diffusion process due to economies <strong>of</strong> scale <strong>and</strong><br />
learning effects. Cost reductions as a function <strong>of</strong> the accumulative production (or<br />
sales) <strong>of</strong> a particular technology can be represented by ‘learning curves’ or<br />
‘experience curves’. Figure 9 shows a learning curve for photovoltaic energy<br />
technology. <strong>The</strong> ‘learning rate’ (the percentage cost reduction with each doubling <strong>of</strong><br />
cumulative production or sales) persisted throughout three decades <strong>of</strong> development<br />
<strong>of</strong> the technology.<br />
IEA (2000) has assessed the potential <strong>of</strong> experience curves as tools to inform <strong>and</strong><br />
strengthen energy technology policy. It stresses the importance <strong>of</strong> measures to<br />
encourage niche markets for new technologies as one <strong>of</strong> the most efficient ways for<br />
governments to provide learning opportunities. McDonald <strong>and</strong> Schrattenholzer<br />
(2001) have assembled data on experience accumulation <strong>and</strong> cost reduction for a<br />
number <strong>of</strong> energy technologies (including wind <strong>and</strong> solar PV). <strong>The</strong>y estimated<br />
learning rates for the resulting 26 data sets, analyzed their variability, <strong>and</strong> evaluated<br />
their usefulness for applications in long-term energy models. Junginger (2005)<br />
applied a learning curve approach to investigate the potential cost reductions in<br />
renewable electricity production technologies, in particular wind <strong>and</strong> biomass based.<br />
He also addressed a number <strong>of</strong> methodological issues related to the construction <strong>and</strong><br />
use <strong>of</strong> learning curves.<br />
Several studies have been carried out to assess the quantitative relationship<br />
between the development <strong>of</strong> costs <strong>of</strong> environmental technologies <strong>and</strong> time. A TME<br />
study (1995) pioneered this, <strong>and</strong> RIVM (2000) further explored the consequences <strong>of</strong><br />
prototypes demo niche early adopters mass application laggards saturation<br />
Fig. 8 Stages in the introduction <strong>of</strong> a new technology; the S-curve