The international economics of resources and resource ... - Index of
The international economics of resources and resource ... - Index of
The international economics of resources and resource ... - Index of

You also want an ePaper? Increase the reach of your titles
YUMPU automatically turns print PDFs into web optimized ePapers that Google loves.
280 P. Ekins<br />
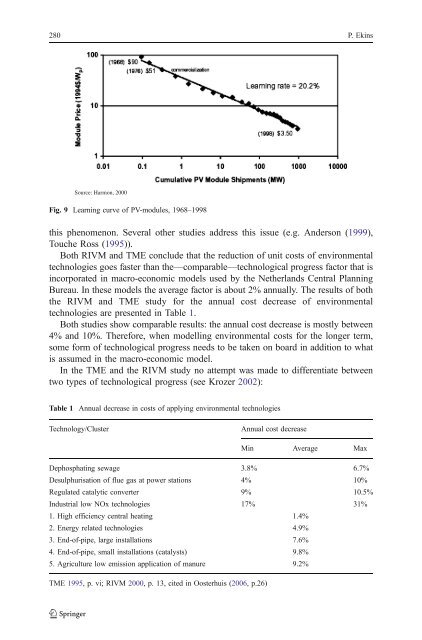
Source: Harmon, 2000<br />
Fig. 9 Learning curve <strong>of</strong> PV-modules, 1968–1998<br />
this phenomenon. Several other studies address this issue (e.g. Anderson (1999),<br />
Touche Ross (1995)).<br />
Both RIVM <strong>and</strong> TME conclude that the reduction <strong>of</strong> unit costs <strong>of</strong> environmental<br />
technologies goes faster than the—comparable—technological progress factor that is<br />
incorporated in macro-economic models used by the Netherl<strong>and</strong>s Central Planning<br />
Bureau. In these models the average factor is about 2% annually. <strong>The</strong> results <strong>of</strong> both<br />
the RIVM <strong>and</strong> TME study for the annual cost decrease <strong>of</strong> environmental<br />
technologies are presented in Table 1.<br />
Both studies show comparable results: the annual cost decrease is mostly between<br />
4% <strong>and</strong> 10%. <strong>The</strong>refore, when modelling environmental costs for the longer term,<br />
some form <strong>of</strong> technological progress needs to be taken on board in addition to what<br />
is assumed in the macro-economic model.<br />
In the TME <strong>and</strong> the RIVM study no attempt was made to differentiate between<br />
two types <strong>of</strong> technological progress (see Krozer 2002):<br />
Table 1 Annual decrease in costs <strong>of</strong> applying environmental technologies<br />
Technology/Cluster Annual cost decrease<br />
Min Average Max<br />
Dephosphating sewage 3.8% 6.7%<br />
Desulphurisation <strong>of</strong> flue gas at power stations 4% 10%<br />
Regulated catalytic converter 9% 10.5%<br />
Industrial low NOx technologies 17% 31%<br />
1. High efficiency central heating 1.4%<br />
2. Energy related technologies 4.9%<br />
3. End-<strong>of</strong>-pipe, large installations 7.6%<br />
4. End-<strong>of</strong>-pipe, small installations (catalysts) 9.8%<br />
5. Agriculture low emission application <strong>of</strong> manure 9.2%<br />
TME 1995, p. vi; RIVM 2000, p. 13, cited in Oosterhuis (2006, p.26)