The international economics of resources and resource ... - Index of
The international economics of resources and resource ... - Index of
The international economics of resources and resource ... - Index of

Create successful ePaper yourself
Turn your PDF publications into a flip-book with our unique Google optimized e-Paper software.
352 C. Lutz<br />
Table 2 EU27 productivity: percentage deviations against respective baselines in 2020<br />
Scenario Material Productivity Energy Productivity Labour Productivity Carbon Productivity<br />
S1H 0.91 6.04 −0.93 8.59<br />
S2H 0.84 7.15 −0.71 8.99<br />
S3H 1.78 15.48 −2.61 21.35<br />
S1L 1.97 12.21 −3.02 17.17<br />
<strong>The</strong> scenarios do not take specific policy measures into account to reach the EU<br />
renewables target <strong>of</strong> a 20% renewables share in final energy consumption in 2020.<br />
But the share will increase from around 10% today to above 14% even in the<br />
baseline with low energy prices as instruments such as feed in tariffs <strong>and</strong> bio fuel<br />
quotas will continue. In scenario S1H the target will be missed with around 18% in<br />
2020. Only in scenarios S2H (almost 20%) <strong>and</strong> S3H (22%), the target is met without<br />
explicit policy efforts.<br />
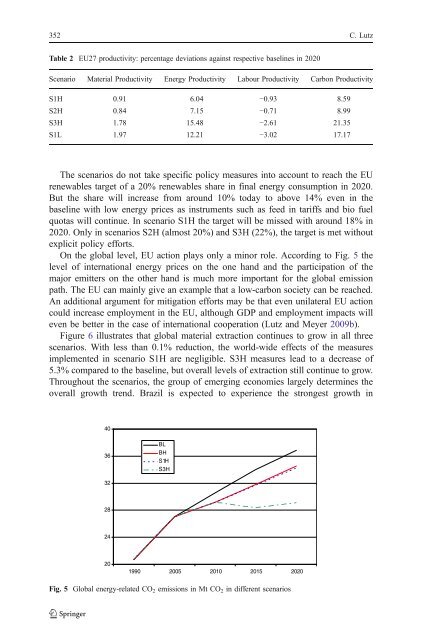
On the global level, EU action plays only a minor role. According to Fig. 5 the<br />
level <strong>of</strong> <strong>international</strong> energy prices on the one h<strong>and</strong> <strong>and</strong> the participation <strong>of</strong> the<br />
major emitters on the other h<strong>and</strong> is much more important for the global emission<br />
path. <strong>The</strong> EU can mainly give an example that a low-carbon society can be reached.<br />
An additional argument for mitigation efforts may be that even unilateral EU action<br />
could increase employment in the EU, although GDP <strong>and</strong> employment impacts will<br />
even be better in the case <strong>of</strong> <strong>international</strong> cooperation (Lutz <strong>and</strong> Meyer 2009b).<br />
Figure 6 illustrates that global material extraction continues to grow in all three<br />
scenarios. With less than 0.1% reduction, the world-wide effects <strong>of</strong> the measures<br />
implemented in scenario S1H are negligible. S3H measures lead to a decrease <strong>of</strong><br />
5.3% compared to the baseline, but overall levels <strong>of</strong> extraction still continue to grow.<br />
Throughout the scenarios, the group <strong>of</strong> emerging economies largely determines the<br />
overall growth trend. Brazil is expected to experience the strongest growth in<br />
40<br />
36<br />
32<br />
28<br />
24<br />
20<br />
BL<br />
BH<br />
S1H<br />
S3H<br />
1990 2005 2010 2015 2020<br />
Fig. 5 Global energy-related CO2 emissions in Mt CO2 in different scenarios