The international economics of resources and resource ... - Index of
The international economics of resources and resource ... - Index of
The international economics of resources and resource ... - Index of

You also want an ePaper? Increase the reach of your titles
YUMPU automatically turns print PDFs into web optimized ePapers that Google loves.
174 P.J.J. Welfens et al.<br />
1.0<br />
0.5<br />
0.0<br />
-0.5<br />
-1.0<br />
2007:<br />
Argentina<br />
Australia<br />
Austria<br />
Azerbaijan<br />
Belgium<br />
Brazil<br />
Bulgaria<br />
Canada<br />
China<br />
Cyprus<br />
Czech Republic<br />
Denmark<br />
Estonia<br />
Finl<strong>and</strong><br />
France<br />
Germany<br />
Greece<br />
Hungary<br />
India<br />
Indonesia<br />
Iran<br />
Irel<strong>and</strong><br />
Israel<br />
Italy<br />
Japan<br />
Kazakhstan<br />
Latvia<br />
Lithuania<br />
Mexico<br />
Netherl<strong>and</strong>s<br />
Norway<br />
Philippines<br />
Pol<strong>and</strong><br />
Portugal<br />
Romania<br />
Russia<br />
Saudi Arabia<br />
Slovak Repulic<br />
Slovenia<br />
South Africa<br />
South Korea<br />
Spain<br />
Sweden<br />
Switzerl<strong>and</strong><br />
Turkey<br />
United<br />
USA<br />
Fig. 6 (continued)<br />
IND (1)+(7)+(B) IND (3)+(7)+(B)<br />
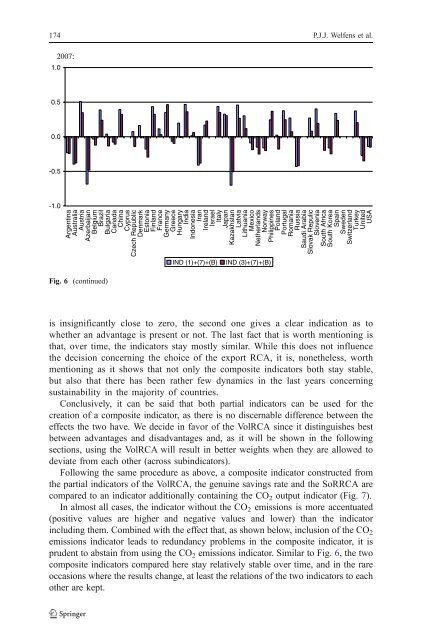
is insignificantly close to zero, the second one gives a clear indication as to<br />
whether an advantage is present or not. <strong>The</strong> last fact that is worth mentioning is<br />
that, over time, the indicators stay mostly similar. While this does not influence<br />
the decision concerning the choice <strong>of</strong> the export RCA, it is, nonetheless, worth<br />
mentioning as it shows that not only the composite indicators both stay stable,<br />
but also that there has been rather few dynamics in the last years concerning<br />
sustainability in the majority <strong>of</strong> countries.<br />
Conclusively, it can be said that both partial indicators can be used for the<br />
creation <strong>of</strong> a composite indicator, as there is no discernable difference between the<br />
effects the two have. We decide in favor <strong>of</strong> the VolRCA since it distinguishes best<br />
between advantages <strong>and</strong> disadvantages <strong>and</strong>, as it will be shown in the following<br />
sections, using the VolRCA will result in better weights when they are allowed to<br />
deviate from each other (across subindicators).<br />
Following the same procedure as above, a composite indicator constructed from<br />
the partial indicators <strong>of</strong> the VolRCA, the genuine savings rate <strong>and</strong> the SoRRCA are<br />
compared to an indicator additionally containing the CO2 output indicator (Fig. 7).<br />
In almost all cases, the indicator without the CO2 emissions is more accentuated<br />
(positive values are higher <strong>and</strong> negative values <strong>and</strong> lower) than the indicator<br />
including them. Combined with the effect that, as shown below, inclusion <strong>of</strong> the CO 2<br />
emissions indicator leads to redundancy problems in the composite indicator, it is<br />
prudent to abstain from using the CO2 emissions indicator. Similar to Fig. 6, the two<br />
composite indicators compared here stay relatively stable over time, <strong>and</strong> in the rare<br />
occasions where the results change, at least the relations <strong>of</strong> the two indicators to each<br />
other are kept.