The international economics of resources and resource ... - Index of
The international economics of resources and resource ... - Index of
The international economics of resources and resource ... - Index of

You also want an ePaper? Increase the reach of your titles
YUMPU automatically turns print PDFs into web optimized ePapers that Google loves.
332 F. Beckenbach, R. Briegel<br />
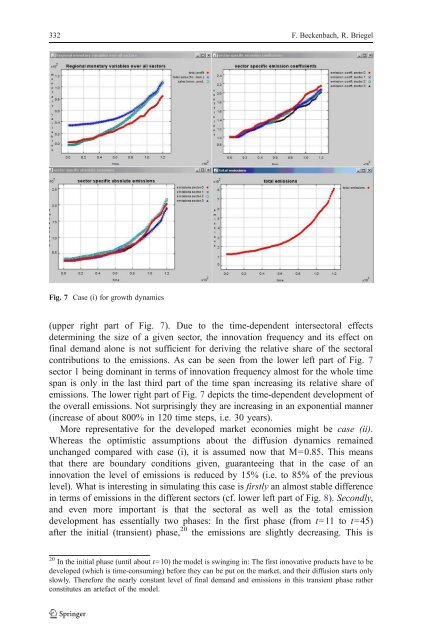
Fig. 7 Case (i) for growth dynamics<br />
(upper right part <strong>of</strong> Fig. 7). Due to the time-dependent intersectoral effects<br />
determining the size <strong>of</strong> a given sector, the innovation frequency <strong>and</strong> its effect on<br />
final dem<strong>and</strong> alone is not sufficient for deriving the relative share <strong>of</strong> the sectoral<br />
contributions to the emissions. As can be seen from the lower left part <strong>of</strong> Fig. 7<br />
sector 1 being dominant in terms <strong>of</strong> innovation frequency almost for the whole time<br />
span is only in the last third part <strong>of</strong> the time span increasing its relative share <strong>of</strong><br />
emissions. <strong>The</strong> lower right part <strong>of</strong> Fig. 7 depicts the time-dependent development <strong>of</strong><br />
the overall emissions. Not surprisingly they are increasing in an exponential manner<br />
(increase <strong>of</strong> about 800% in 120 time steps, i.e. 30 years).<br />
More representative for the developed market economies might be case (ii).<br />
Whereas the optimistic assumptions about the diffusion dynamics remained<br />
unchanged compared with case (i), it is assumed now that M=0.85. This means<br />
that there are boundary conditions given, guaranteeing that in the case <strong>of</strong> an<br />
innovation the level <strong>of</strong> emissions is reduced by 15% (i.e. to 85% <strong>of</strong> the previous<br />
level). What is interesting in simulating this case is firstly an almost stable difference<br />
in terms <strong>of</strong> emissions in the different sectors (cf. lower left part <strong>of</strong> Fig. 8). Secondly,<br />
<strong>and</strong> even more important is that the sectoral as well as the total emission<br />
development has essentially two phases: In the first phase (from t=11 to t=45)<br />
after the initial (transient) phase, 20 the emissions are slightly decreasing. This is<br />
20 In the initial phase (until about t=10) the model is swinging in: <strong>The</strong> first innovative products have to be<br />
developed (which is time-consuming) before they can be put on the market, <strong>and</strong> their diffusion starts only<br />
slowly. <strong>The</strong>refore the nearly constant level <strong>of</strong> final dem<strong>and</strong> <strong>and</strong> emissions in this transient phase rather<br />
constitutes an artefact <strong>of</strong> the model.