The international economics of resources and resource ... - Index of
The international economics of resources and resource ... - Index of
The international economics of resources and resource ... - Index of

You also want an ePaper? Increase the reach of your titles
YUMPU automatically turns print PDFs into web optimized ePapers that Google loves.
International <strong>economics</strong> <strong>of</strong> <strong>resource</strong> productivity... 233<br />
An average European uses about four times more <strong><strong>resource</strong>s</strong> per capita than<br />
inhabitants <strong>of</strong> Africa <strong>and</strong> three times more than in Asia.<br />
<strong>The</strong> level <strong>and</strong> patterns <strong>of</strong> <strong>resource</strong> use differ across countries. With an average <strong>of</strong><br />
roughly 15 tons per capita according to the most commonly used indicator ‚Direct<br />
Material Input’, residents <strong>of</strong> the EU-27 use about half the <strong><strong>resource</strong>s</strong> compared to<br />
citizens <strong>of</strong> Australia, Canada <strong>and</strong> the United States, but about 25 % more than Japan<br />
<strong>and</strong> Switzerl<strong>and</strong>. Within the EU-15 per capita consumption varies between 45t per<br />
capita (Finl<strong>and</strong>) <strong>and</strong> 14t per capita (Italy) – a significant difference. Highly uneven<br />
patterns are also to be found in Asia. While a Bangladeshi consumes around 1,2 t <strong>of</strong><br />
materials every year, <strong>resource</strong> use is at the order <strong>of</strong> 45 t per capita in small <strong>and</strong> rich<br />
oil-exporting countries such as Bahrain. China is currently estimated to consume<br />
materials in the order <strong>of</strong> 6,5 t per capita. In many medium <strong>and</strong> high-income countries<br />
such as South Korea, Israel, or Saudi Arabia, annual consumption is in the order <strong>of</strong><br />
15 t / per capita, only slightly lower than the OECD average (Giljum et al. 2010: 3).<br />
It is interesting to note that some large economies experienced a modest decrease<br />
in the direct use <strong>of</strong> <strong><strong>resource</strong>s</strong> between 1992 <strong>and</strong> 2005. <strong>The</strong>se include Germany,<br />
France, the United Kingdom, the Czech Republic <strong>and</strong> Sweden. It is also worth<br />
noting that Japan experienced the highest (22%) reduction in <strong>resource</strong> use per capita.<br />
Norway, Canada <strong>and</strong> Switzerl<strong>and</strong> also reduced their figures from 1992 to 2005.<br />
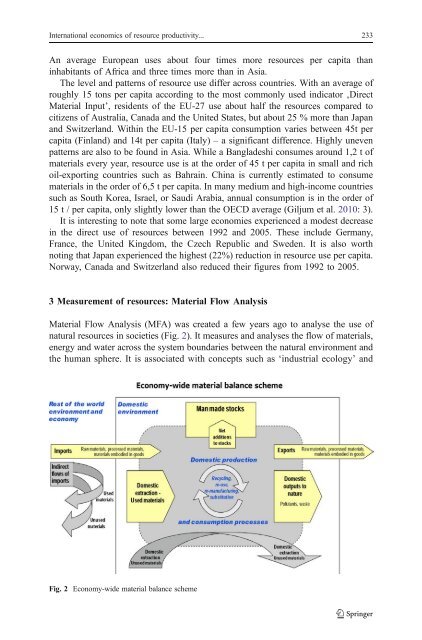
3 Measurement <strong>of</strong> <strong><strong>resource</strong>s</strong>: Material Flow Analysis<br />
Material Flow Analysis (MFA) was created a few years ago to analyse the use <strong>of</strong><br />
natural <strong><strong>resource</strong>s</strong> in societies (Fig. 2). It measures <strong>and</strong> analyses the flow <strong>of</strong> materials,<br />
energy <strong>and</strong> water across the system boundaries between the natural environment <strong>and</strong><br />
the human sphere. It is associated with concepts such as ‘industrial ecology’ <strong>and</strong><br />
Fig. 2 Economy-wide material balance scheme