The international economics of resources and resource ... - Index of
The international economics of resources and resource ... - Index of
The international economics of resources and resource ... - Index of

You also want an ePaper? Increase the reach of your titles
YUMPU automatically turns print PDFs into web optimized ePapers that Google loves.
168 P.J.J. Welfens et al.<br />
1<br />
0,8<br />
0,6<br />
0,4<br />
0,2<br />
0<br />
-0,2<br />
-0,4<br />
-0,6<br />
-0,8<br />
-1<br />
1<br />
0,8<br />
0,6<br />
0,4<br />
0,2<br />
0<br />
-0,2<br />
-0,4<br />
-0,6<br />
-0,8<br />
-1<br />
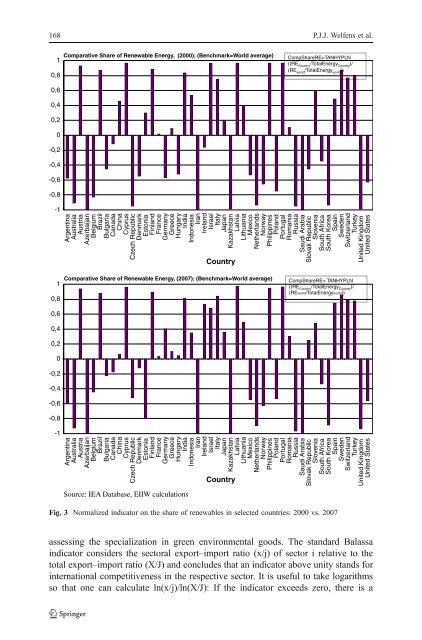
Comparative Share <strong>of</strong> Renewable Energy, (2000); (Benchmark=World average) CompShareRE=TANHYPLN<br />
((RE Country /TotalEnergy Country )/<br />
(RE world /TotalEnergy world ))<br />
Argentina<br />
Australia<br />
Austria<br />
Azerbaijan<br />
Belgium<br />
Brazil<br />
Bulgaria<br />
Canada<br />
China<br />
Cyprus<br />
Czech Republic<br />
Denmark<br />
Estonia<br />
Finl<strong>and</strong><br />
France<br />
Germany<br />
Greece<br />
Hungary<br />
India<br />
Indonesia<br />
Iran<br />
Irel<strong>and</strong><br />
Israel<br />
Italy<br />
Japan<br />
Kazakhstan<br />
Latvia<br />
Lithuania<br />
Mexico<br />
Netherl<strong>and</strong>s<br />
Norway<br />
Philippines<br />
Pol<strong>and</strong><br />
Portugal<br />
Romania<br />
Russia<br />
Saudi Arabia<br />
Slovak Republic<br />
Slovenia<br />
South Africa<br />
South Korea<br />
Spain<br />
Sweden<br />
Switzerl<strong>and</strong><br />
Turkey<br />
United Kingdom<br />
United States<br />
Country<br />
Comparative Share <strong>of</strong> Renewable Energy, (2007); (Benchmark=World average) CompShareRE= TANHYPLN<br />
((RE Country /TotalEnergy Country )/<br />
(REworld/TotalEnergyworld))<br />
Argentina<br />
Australia<br />
Austria<br />
Azerbaijan<br />
Belgium<br />
Brazil<br />
Bulgaria<br />
Canada<br />
China<br />
Cyprus<br />
Czech Republic<br />
Denmark<br />
Estonia<br />
Finl<strong>and</strong><br />
France<br />
Germany<br />
Greece<br />
Hungary<br />
India<br />
Indonesia<br />
Iran<br />
Irel<strong>and</strong><br />
Israel<br />
Italy<br />
Japan<br />
Kazakhstan<br />
Latvia<br />
Lithuania<br />
Mexico<br />
Netherl<strong>and</strong>s<br />
Norway<br />
Philippines<br />
Pol<strong>and</strong><br />
Portugal<br />
Romania<br />
Russia<br />
Saudi Arabia<br />
Slovak Republic<br />
Slovenia<br />
South Africa<br />
South Korea<br />
Spain<br />
Sweden<br />
Switzerl<strong>and</strong><br />
Turkey<br />
United Kingdom<br />
United States<br />
Source: IEA Database, EIIW calculations<br />
Country<br />
Fig. 3 Normalized indicator on the share <strong>of</strong> renewables in selected countries: 2000 vs. 2007<br />
assessing the specialization in green environmental goods. <strong>The</strong> st<strong>and</strong>ard Balassa<br />
indicator considers the sectoral export–import ratio (x/j) <strong>of</strong> sector i relative to the<br />
total export–import ratio (X/J) <strong>and</strong> concludes that an indicator above unity st<strong>and</strong>s for<br />
<strong>international</strong> competitiveness in the respective sector. It is useful to take logarithms<br />
so that one can calculate ln(x/j)/ln(X/J): If the indicator exceeds zero, there is a