The genus Cladosporium and similar dematiaceous ... - CBS - KNAW
The genus Cladosporium and similar dematiaceous ... - CBS - KNAW
The genus Cladosporium and similar dematiaceous ... - CBS - KNAW

You also want an ePaper? Increase the reach of your titles
YUMPU automatically turns print PDFs into web optimized ePapers that Google loves.
De Hoog et al.<br />
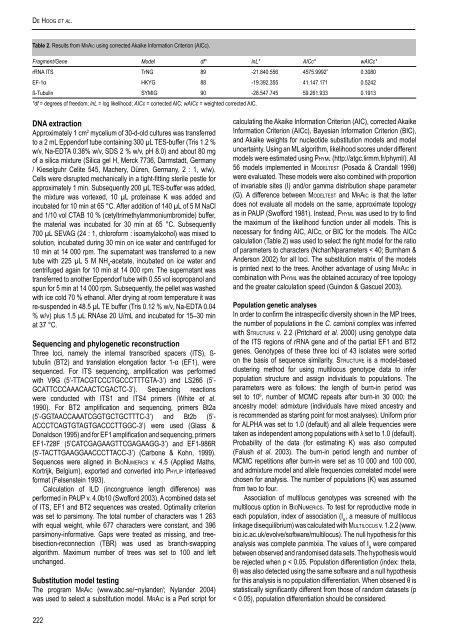
Table 2. Results from MrAic using corrected Akaike Information Criterion (AICc).<br />
Fragment/Gene Model df* lnL* AICc* wAICc*<br />
rRNA ITS TrNG 89 -21.840.556 4575.9992” 0.3080<br />
EF-1α HKYG 88 -19.392.355 41.147.171 0.5242<br />
ß-Tubulin SYMIG 90 -28.547.745 59.261.933 0.1913<br />
*df = degrees of freedom; lnL = log likelihood; AICc = corrected AIC; wAICc = weighted corrected AIC.<br />
DNA extraction<br />
Approximately 1 cm 2 mycelium of 30-d-old cultures was transferred<br />
to a 2 mL Eppendorf tube containing 300 µL TES-buffer (Tris 1.2 %<br />
w/v, Na-EDTA 0.38% w/v, SDS 2 % w/v, pH 8.0) <strong>and</strong> about 80 mg<br />
of a silica mixture (Silica gel H, Merck 7736, Darmstadt, Germany<br />
/ Kieselguhr Celite 545, Machery, Düren, Germany, 2 : 1, w/w).<br />
Cells were disrupted mechanically in a tight-fitting sterile pestle for<br />
approximately 1 min. Subsequently 200 µL TES-buffer was added,<br />
the mixture was vortexed, 10 µL proteinase K was added <strong>and</strong><br />
incubated for 10 min at 65 °C. After addition of 140 µL of 5 M NaCl<br />
<strong>and</strong> 1/10 vol CTAB 10 % (cetyltrimethylammoniumbromide) buffer,<br />
the material was incubated for 30 min at 65 °C. Subsequently<br />
700 µL SEVAG (24 : 1, chloroform : isoamylalcohol) was mixed to<br />
solution, incubated during 30 min on ice water <strong>and</strong> centrifuged for<br />
10 min at 14 000 rpm. <strong>The</strong> supernatant was transferred to a new<br />
tube with 225 µL 5 M NH 4<br />
-acetate, incubated on ice water <strong>and</strong><br />
centrifuged again for 10 min at 14 000 rpm. <strong>The</strong> supernatant was<br />
transferred to another Eppendorf tube with 0.55 vol isopropanol <strong>and</strong><br />
spun for 5 min at 14 000 rpm. Subsequently, the pellet was washed<br />
with ice cold 70 % ethanol. After drying at room temperature it was<br />
re-suspended in 48.5 µL TE buffer (Tris 0.12 % w/v, Na-EDTA 0.04<br />
% w/v) plus 1.5 µL RNAse 20 U/mL <strong>and</strong> incubated for 15–30 min<br />
at 37 °C.<br />
Sequencing <strong>and</strong> phylogenetic reconstruction<br />
Three loci, namely the internal transcribed spacers (ITS), ß-<br />
tubulin (BT2) <strong>and</strong> translation elongation factor 1-α (EF1), were<br />
sequenced. For ITS sequencing, amplification was performed<br />
with V9G (5’-TTACGTCCCTGCCCTTTGTA-3’) <strong>and</strong> LS266 (5’-<br />
GCATTCCCAAACAACTCGACTC-3’). Sequencing reactions<br />
were conducted with ITS1 <strong>and</strong> ITS4 primers (White et al.<br />
1990). For BT2 amplification <strong>and</strong> sequencing, primers Bt2a<br />
(5’-GGTAACCAAATCGGTGCTGCTTTC-3’) <strong>and</strong> Bt2b (5’-<br />
ACCCTCAGTGTAGTGACCCTTGGC-3’) were used (Glass &<br />
Donaldson 1995) <strong>and</strong> for EF1 amplification <strong>and</strong> sequencing, primers<br />
EF1-728F (5’CATCGAGAAGTTCGAGAAGG-3’) <strong>and</strong> EF1-986R<br />
(5’-TACTTGAAGGAACCCTTACC-3’) (Carbone & Kohn, 1999).<br />
Sequences were aligned in BioNumerics v. 4.5 (Applied Maths,<br />
Kortrijk, Belgium), exported <strong>and</strong> converted into Phylip interleaved<br />
format (Felsenstein 1993).<br />
Calculation of ILD (incongruence length difference) was<br />
performed in PAUP v. 4.0b10 (Swofford 2003). A combined data set<br />
of ITS, EF1 <strong>and</strong> BT2 sequences was created. Optimality criterion<br />
was set to parsimony. <strong>The</strong> total number of characters was 1 263<br />
with equal weight, while 677 characters were constant, <strong>and</strong> 396<br />
parsimony-informative. Gaps were treated as missing, <strong>and</strong> treebisection-reconnection<br />
(TBR) was used as branch-swapping<br />
algorithm. Maximum number of trees was set to 100 <strong>and</strong> left<br />
unchanged.<br />
Substitution model testing<br />
<strong>The</strong> program MrAic (www.abc.se/~nyl<strong>and</strong>er/; Nyl<strong>and</strong>er 2004)<br />
was used to select a substitution model. MrAic is a Perl script for<br />
calculating the Akaike Information Criterion (AIC), corrected Akaike<br />
Information Criterion (AICc), Bayesian Information Criterion (BIC),<br />
<strong>and</strong> Akaike weights for nucleotide substitution models <strong>and</strong> model<br />
uncertainty. Using an ML algorithm, likelihood scores under different<br />
models were estimated using Phyml (http://atgc.lirmm.fr/phyml/). All<br />
56 models implemented in Modeltest (Posada & Cr<strong>and</strong>all 1998)<br />
were evaluated. <strong>The</strong>se models were also combined with proportion<br />
of invariable sites (I) <strong>and</strong>/or gamma distribution shape parameter<br />
(G). A difference between Modeltest <strong>and</strong> MrAic is that the latter<br />
does not evaluate all models on the same, approximate topology<br />
as in PAUP (Swofford 1981). Instead, Phyml was used to try to find<br />
the maximum of the likelihood function under all models. This is<br />
necessary for finding AIC, AICc, or BIC for the models. <strong>The</strong> AICc<br />
calculation (Table 2) was used to select the right model for the ratio<br />
of parameters to characters (Nchar/Nparameters < 40; Burnham &<br />
Anderson 2002) for all loci. <strong>The</strong> substitution matrix of the models<br />
is printed next to the trees. Another advantage of using MrAic in<br />
combination with Phyml was the obtained accuracy of tree topology<br />
<strong>and</strong> the greater calculation speed (Guindon & Gascuel 2003).<br />
Population genetic analyses<br />
In order to confirm the intraspecific diversity shown in the MP trees,<br />
the number of populations in the C. carrionii complex was inferred<br />
with Structure v. 2.2 (Pritchard et al. 2000) using genotype data<br />
of the ITS regions of rRNA gene <strong>and</strong> of the partial EF1 <strong>and</strong> BT2<br />
genes. Genotypes of these three loci of 43 isolates were sorted<br />
on the basis of sequence <strong>similar</strong>ity. Structure is a model-based<br />
clustering method for using multilocus genotype data to infer<br />
population structure <strong>and</strong> assign individuals to populations. <strong>The</strong><br />
parameters were as follows: the length of burn-in period was<br />
set to 10 6 , number of MCMC repeats after burn-in 30 000; the<br />
ancestry model: admixture (individuals have mixed ancestry <strong>and</strong><br />
is recommended as starting point for most analyses). Uniform prior<br />
for ALPHA was set to 1.0 (default) <strong>and</strong> all allele frequencies were<br />
taken as independent among populations with λ set to 1.0 (default).<br />
Probability of the data (for estimating K) was also computed<br />
(Falush et al. 2003). <strong>The</strong> burn-in period length <strong>and</strong> number of<br />
MCMC repetitions after burn-in were set as 10 000 <strong>and</strong> 100 000,<br />
<strong>and</strong> admixture model <strong>and</strong> allele frequencies correlated model were<br />
chosen for analysis. <strong>The</strong> number of populations (K) was assumed<br />
from two to four.<br />
Association of multilocus genotypes was screened with the<br />
multilocus option in BioNumerics. To test for reproductive mode in<br />
each population, index of association (I A<br />
, a measure of multilocus<br />
linkage disequilibrium) was calculated with Multilocus v. 1.2.2 (www.<br />
bio.ic.ac.uk/evolve/software/multilocus). <strong>The</strong> null hypothesis for this<br />
analysis was complete panmixia. <strong>The</strong> values of I A<br />
were compared<br />
between observed <strong>and</strong> r<strong>and</strong>omised data sets. <strong>The</strong> hypothesis would<br />
be rejected when p < 0.05. Population differentiation (index: theta,<br />
θ) was also detected using the same software <strong>and</strong> a null hypothesis<br />
for this analysis is no population differentiation. When observed θ is<br />
statistically significantly different from those of r<strong>and</strong>om datasets (p<br />
< 0.05), population differentiation should be considered.<br />
222