2010-2014 Consolidated Plan - City of Champaign
2010-2014 Consolidated Plan - City of Champaign
2010-2014 Consolidated Plan - City of Champaign

Create successful ePaper yourself
Turn your PDF publications into a flip-book with our unique Google optimized e-Paper software.
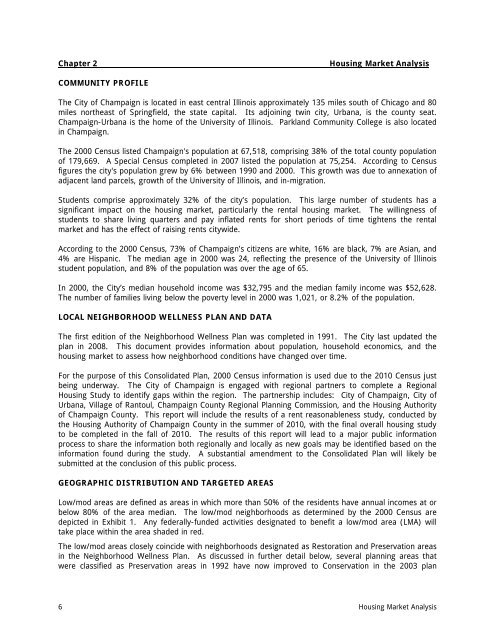
Chapter 2Housing Market AnalysisCOMMUNITY PROFILEThe <strong>City</strong> <strong>of</strong> <strong>Champaign</strong> is located in east central Illinois approximately 135 miles south <strong>of</strong> Chicago and 80miles northeast <strong>of</strong> Springfield, the state capital. Its adjoining twin city, Urbana, is the county seat.<strong>Champaign</strong>-Urbana is the home <strong>of</strong> the University <strong>of</strong> Illinois. Parkland Community College is also locatedin <strong>Champaign</strong>.The 2000 Census listed <strong>Champaign</strong>'s population at 67,518, comprising 38% <strong>of</strong> the total county population<strong>of</strong> 179,669. A Special Census completed in 2007 listed the population at 75,254. According to Censusfigures the city's population grew by 6% between 1990 and 2000. This growth was due to annexation <strong>of</strong>adjacent land parcels, growth <strong>of</strong> the University <strong>of</strong> Illinois, and in-migration.Students comprise approximately 32% <strong>of</strong> the city’s population. This large number <strong>of</strong> students has asignificant impact on the housing market, particularly the rental housing market. The willingness <strong>of</strong>students to share living quarters and pay inflated rents for short periods <strong>of</strong> time tightens the rentalmarket and has the effect <strong>of</strong> raising rents citywide.According to the 2000 Census, 73% <strong>of</strong> <strong>Champaign</strong>’s citizens are white, 16% are black, 7% are Asian, and4% are Hispanic. The median age in 2000 was 24, reflecting the presence <strong>of</strong> the University <strong>of</strong> Illinoisstudent population, and 8% <strong>of</strong> the population was over the age <strong>of</strong> 65.In 2000, the <strong>City</strong>’s median household income was $32,795 and the median family income was $52,628.The number <strong>of</strong> families living below the poverty level in 2000 was 1,021, or 8.2% <strong>of</strong> the population.LOCAL NEIGHBORHOOD WELLNESS PLAN AND DATAThe first edition <strong>of</strong> the Neighborhood Wellness <strong>Plan</strong> was completed in 1991. The <strong>City</strong> last updated theplan in 2008. This document provides information about population, household economics, and thehousing market to assess how neighborhood conditions have changed over time.For the purpose <strong>of</strong> this <strong>Consolidated</strong> <strong>Plan</strong>, 2000 Census information is used due to the <strong>2010</strong> Census justbeing underway. The <strong>City</strong> <strong>of</strong> <strong>Champaign</strong> is engaged with regional partners to complete a RegionalHousing Study to identify gaps within the region. The partnership includes: <strong>City</strong> <strong>of</strong> <strong>Champaign</strong>, <strong>City</strong> <strong>of</strong>Urbana, Village <strong>of</strong> Rantoul, <strong>Champaign</strong> County Regional <strong>Plan</strong>ning Commission, and the Housing Authority<strong>of</strong> <strong>Champaign</strong> County. This report will include the results <strong>of</strong> a rent reasonableness study, conducted bythe Housing Authority <strong>of</strong> <strong>Champaign</strong> County in the summer <strong>of</strong> <strong>2010</strong>, with the final overall housing studyto be completed in the fall <strong>of</strong> <strong>2010</strong>. The results <strong>of</strong> this report will lead to a major public informationprocess to share the information both regionally and locally as new goals may be identified based on theinformation found during the study. A substantial amendment to the <strong>Consolidated</strong> <strong>Plan</strong> will likely besubmitted at the conclusion <strong>of</strong> this public process.GEOGRAPHIC DISTRIBUTION AND TARGETED AREASLow/mod areas are defined as areas in which more than 50% <strong>of</strong> the residents have annual incomes at orbelow 80% <strong>of</strong> the area median. The low/mod neighborhoods as determined by the 2000 Census aredepicted in Exhibit 1. Any federally-funded activities designated to benefit a low/mod area (LMA) willtake place within the area shaded in red.The low/mod areas closely coincide with neighborhoods designated as Restoration and Preservation areasin the Neighborhood Wellness <strong>Plan</strong>. As discussed in further detail below, several planning areas thatwere classified as Preservation areas in 1992 have now improved to Conservation in the 2003 plan6 Housing Market Analysis