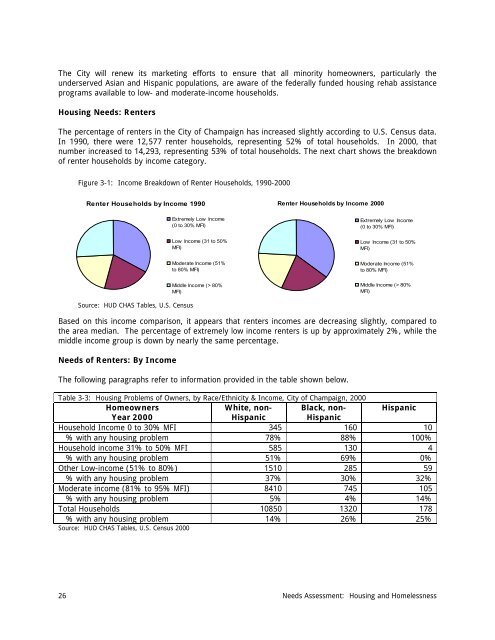
- Page 1 and 2: 2010-2014Consolidated Plan2010/11 A
- Page 3: This page intentionally left blank
- Page 11 and 12: This page intentionally left blankv
- Page 13 and 14: • Provide decent, affordable hous
- Page 15 and 16: homeless populations. The City cont
- Page 17 and 18: Summary of Citizen ParticipationDat
- Page 19 and 20: The City held three public hearings
- Page 21 and 22: Chapter 2Housing Market AnalysisCOM
- Page 23 and 24: compared to the remainder of the Ci
- Page 25 and 26: single parent households increased
- Page 27 and 28: Census. The U.S. Census Bureau esti
- Page 29 and 30: Table 2-1: Housing Opportunity Inde
- Page 31 and 32: All but three planning areas have h
- Page 33 and 34: Loan Denial Rates by Race and Incom
- Page 35 and 36: • Additional affordable or subsid
- Page 37 and 38: 2014 Consolidated Plan and will be
- Page 39: Because the cost of homeownership i
- Page 43 and 44: of Champaign programs, are meeting
- Page 45 and 46: At incomes of
- Page 47 and 48: in the long-term. The City will con
- Page 49 and 50: from a disabling condition (usually
- Page 51 and 52: Almost all of the agencies that pro
- Page 53 and 54: monies to provide housing assistanc
- Page 55 and 56: Discharge Coordination PolicyContin
- Page 57 and 58: provide structural modifications an
- Page 59 and 60: Persons with Developmental Disabili
- Page 61 and 62: entering substance abuse treatment
- Page 63 and 64: RESTORATION OR REVITALIZATION NEEDS
- Page 65 and 66: licensed day care facility, nursery
- Page 67 and 68: portion of the workshop is devoted
- Page 69 and 70: • 27 playgrounds• 24 outdoor te
- Page 71 and 72: Alley ConditionA majority of the Ci
- Page 73 and 74: - lack of a multi-year schedule for
- Page 75 and 76: Redevelopment Initiatives - Commerc
- Page 77 and 78: Job TrainingThe Champaign Consortiu
- Page 79 and 80: improving their skills and career o
- Page 81 and 82: The development that occurred as a
- Page 83 and 84: organizations. The creation of the
- Page 85 and 86: non-profits (such as Habitat for Hu
- Page 87 and 88: Activities:1) Targeted Full Home Im
- Page 89 and 90: creation and preservation of afford
- Page 91 and 92:
4) Employer Assisted Housing: Explo
- Page 93 and 94:
housing units are located. The City
- Page 95 and 96:
successful. These supportive servic
- Page 97 and 98:
3) Accessible New Construction: Pro
- Page 99 and 100:
3) Prevention Education: Reduce the
- Page 101 and 102:
Strategies:a) Maintain the safety a
- Page 103 and 104:
) Support programs that provide hig
- Page 105 and 106:
Activities:1) Neighborhood Small Gr
- Page 107 and 108:
The information collected through t
- Page 109 and 110:
addressing blighted properties owne
- Page 111 and 112:
Non-Housing Community Development A
- Page 113 and 114:
America Saves is designed to reinfo
- Page 115 and 116:
The Neighborhood Services Departmen
- Page 117 and 118:
Homeowner Investment X NetHOME inve
- Page 119 and 120:
impacts the housing market in terms
- Page 121 and 122:
FY 2010/11 AAP Chapter 3:Affordable
- Page 123 and 124:
) Improve the condition of rental p
- Page 125 and 126:
) Reduce other blighting influences
- Page 127 and 128:
with Champaign County Regional Plan
- Page 129 and 130:
Habitat for Humanity chapter to ide
- Page 131 and 132:
Inputs: $10,000 per lot is availabl
- Page 133 and 134:
service providers facilitate an eff
- Page 135 and 136:
make existing affordable units acce
- Page 137 and 138:
Objectives:a) Coordinate public and
- Page 139 and 140:
FY 2010/11 AAP Chapter 4:Non-Housin
- Page 141 and 142:
approximately 4,900 persons, over 5
- Page 143 and 144:
128 FY 2010/11 Annual Action Plan:
- Page 145 and 146:
Objectives:a) Support programs to e
- Page 147 and 148:
School Resource Officer Program: Fo
- Page 149 and 150:
associations registered with the Ci
- Page 151 and 152:
FY 2010/11 AAP Chapter 6:HUD CPMP P
- Page 153 and 154:
FY 2010/11 AAP Chapter 5:FY 2010/11
- Page 155 and 156:
L M HA c c o m p l . T y p e :I n c
- Page 157 and 158:
L M HA c c o m p l . T y p e :I m p
- Page 159 and 160:
L M HA c c o m p l . T y p e :I n c
- Page 161 and 162:
L M HA c c o m p l . T y p e :I m p
- Page 163 and 164:
L M HA c c o m p l . T y p e :I n c
- Page 165 and 166:
L M CA c c o m p l . T y p e :I m p
- Page 167 and 168:
N o t A p p l i c a b l eA c c o m
- Page 180 and 181:
Appendix AConsultation/Participatio
- Page 182 and 183:
Appendix B 167
- Page 184 and 185:
• Clear floor space (18” minimu
- Page 186 and 187:
Laundry Areas• Front loading wash
- Page 188 and 189:
Appendix DCity Approved Visitabilit
- Page 190 and 191:
Exception: This does not apply to p
- Page 192 and 193:
Cost Burden, Extreme (or Severe): T
- Page 194 and 195:
friction surfaces, or impact servic
- Page 196 and 197:
SRO: Single-Room Occupancy.Subsidiz
- Page 198 and 199:
Appendix FCitizen Participation Pla
- Page 200 and 201:
E. PUBLIC HEARINGSDuring the Consol
- Page 202 and 203:
- Submission of objections within 3
- Page 204 and 205:
-- The development of the Consolida
- Page 206 and 207:
Neighborhood Services DepartmentNei
- Page 208 and 209:
Kerri stated it needs to be under c
- Page 210 and 211:
longer be considered a pilot progra
- Page 212 and 213:
CHAMPAIGN CITY COUNCILRegular Counc
- Page 214 and 215:
AUDIENCE PARTICIPATION:Firefighter
- Page 216 and 217:
Appendix HAnti-DisplacementFOR Comm
- Page 218 and 219:
SECTION ISTEPS TO BE TAKEN TO MINIM
- Page 220 and 221:
SECTION IISTEPS TO BE TAKEN WHEN LO
- Page 222 and 223:
moderate income households that are
- Page 224 and 225:
SECTION IIISTEPS TO BE TAKEN WHEN C
- Page 226 and 227:
1. The lessor of the monthly cost o
- Page 228 and 229:
displacement, stating who will be r
- Page 230 and 231:
funding the project, or the displac
- Page 232 and 233:
Appendix AGLOSSARY OF TERMSBelow ar
- Page 234 and 235:
project is subject to the Uniform A
- Page 236 and 237:
Appendix BAPPEALSThe City of Champa
- Page 238 and 239:
Appendix COne for One Replacement P
- Page 240 and 241:
Appendix IHUD CPMP Needs Worksheets
- Page 242 and 243:
Table 1BSpecial Needs (Non-Homeless
- Page 244 and 245:
Table 2APriority Housing Needs/Inve
- Page 246 and 247:
Table 2BPriority NeedAcquisition of
- Page 248 and 249:
Housing Inventory Chart: Emergency
- Page 250 and 251:
Housing Inventory Chart: Safe Haven
- Page 252:
Housing Inventory Chart: Unmet Need


