2010-2014 Consolidated Plan - City of Champaign
2010-2014 Consolidated Plan - City of Champaign
2010-2014 Consolidated Plan - City of Champaign

You also want an ePaper? Increase the reach of your titles
YUMPU automatically turns print PDFs into web optimized ePapers that Google loves.
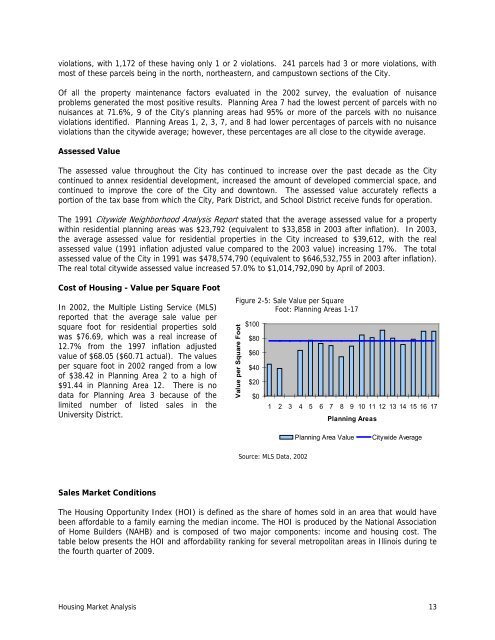
violations, with 1,172 <strong>of</strong> these having only 1 or 2 violations. 241 parcels had 3 or more violations, withmost <strong>of</strong> these parcels being in the north, northeastern, and campustown sections <strong>of</strong> the <strong>City</strong>.Of all the property maintenance factors evaluated in the 2002 survey, the evaluation <strong>of</strong> nuisanceproblems generated the most positive results. <strong>Plan</strong>ning Area 7 had the lowest percent <strong>of</strong> parcels with nonuisances at 71.6%, 9 <strong>of</strong> the <strong>City</strong>’s planning areas had 95% or more <strong>of</strong> the parcels with no nuisanceviolations identified. <strong>Plan</strong>ning Areas 1, 2, 3, 7, and 8 had lower percentages <strong>of</strong> parcels with no nuisanceviolations than the citywide average; however, these percentages are all close to the citywide average.Assessed ValueThe assessed value throughout the <strong>City</strong> has continued to increase over the past decade as the <strong>City</strong>continued to annex residential development, increased the amount <strong>of</strong> developed commercial space, andcontinued to improve the core <strong>of</strong> the <strong>City</strong> and downtown. The assessed value accurately reflects aportion <strong>of</strong> the tax base from which the <strong>City</strong>, Park District, and School District receive funds for operation.The 1991 <strong>City</strong>wide Neighborhood Analysis Report stated that the average assessed value for a propertywithin residential planning areas was $23,792 (equivalent to $33,858 in 2003 after inflation). In 2003,the average assessed value for residential properties in the <strong>City</strong> increased to $39,612, with the realassessed value (1991 inflation adjusted value compared to the 2003 value) increasing 17%. The totalassessed value <strong>of</strong> the <strong>City</strong> in 1991 was $478,574,790 (equivalent to $646,532,755 in 2003 after inflation).The real total citywide assessed value increased 57.0% to $1,014,792,090 by April <strong>of</strong> 2003.Cost <strong>of</strong> Housing - Value per Square FootIn 2002, the Multiple Listing Service (MLS)reported that the average sale value persquare foot for residential properties soldwas $76.69, which was a real increase <strong>of</strong>12.7% from the 1997 inflation adjustedvalue <strong>of</strong> $68.05 ($60.71 actual). The valuesper square foot in 2002 ranged from a low<strong>of</strong> $38.42 in <strong>Plan</strong>ning Area 2 to a high <strong>of</strong>$91.44 in <strong>Plan</strong>ning Area 12. There is nodata for <strong>Plan</strong>ning Area 3 because <strong>of</strong> thelimited number <strong>of</strong> listed sales in theUniversity District.Figure 2-5: Sale Value per SquareFoot: <strong>Plan</strong>ning Areas 1-17Value per Square Foot$100$80$60$40$20$01 2 3 4 5 6 7 8 9 10 11 12 13 14 15 16 17<strong>Plan</strong>ning Areas<strong>Plan</strong>ning Area Value<strong>City</strong>wide AverageSource: MLS Data, 2002Sales Market ConditionsThe Housing Opportunity Index (HOI) is defined as the share <strong>of</strong> homes sold in an area that would havebeen affordable to a family earning the median income. The HOI is produced by the National Association<strong>of</strong> Home Builders (NAHB) and is composed <strong>of</strong> two major components: income and housing cost. Thetable below presents the HOI and affordability ranking for several metropolitan areas in Illinois during tethe fourth quarter <strong>of</strong> 2009.Housing Market Analysis 13