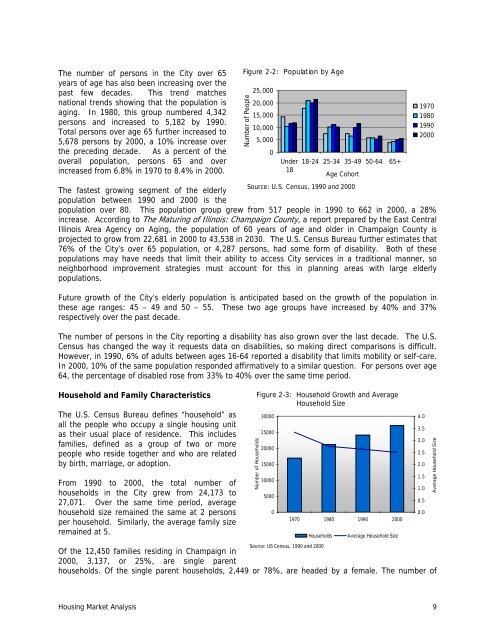
The number <strong>of</strong> persons in the <strong>City</strong> over 65years <strong>of</strong> age has also been increasing over thepast few decades. This trend matchesnational trends showing that the population isaging. In 1980, this group numbered 4,342persons and increased to 5,182 by 1990.Total persons over age 65 further increased to5,678 persons by 2000, a 10% increase overthe preceding decade. As a percent <strong>of</strong> theoverall population, persons 65 and overincreased from 6.8% in 1970 to 8.4% in 2000.The fastest growing segment <strong>of</strong> the elderlypopulation between 1990 and 2000 is thepopulation over 80. This population group grew from 517 people in 1990 to 662 in 2000, a 28%increase. According to The Maturing <strong>of</strong> Illinois: <strong>Champaign</strong> County, a report prepared by the East CentralIllinois Area Agency on Aging, the population <strong>of</strong> 60 years <strong>of</strong> age and older in <strong>Champaign</strong> County isprojected to grow from 22,681 in 2000 to 43,538 in 2030. The U.S. Census Bureau further estimates that76% <strong>of</strong> the <strong>City</strong>’s over 65 population, or 4,287 persons, had some form <strong>of</strong> disability. Both <strong>of</strong> thesepopulations may have needs that limit their ability to access <strong>City</strong> services in a traditional manner, soneighborhood improvement strategies must account for this in planning areas with large elderlypopulations.Future growth <strong>of</strong> the <strong>City</strong>’s elderly population is anticipated based on the growth <strong>of</strong> the population inthese age ranges: 45 – 49 and 50 – 55. These two age groups have increased by 40% and 37%respectively over the past decade.The number <strong>of</strong> persons in the <strong>City</strong> reporting a disability has also grown over the last decade. The U.S.Census has changed the way it requests data on disabilities, so making direct comparisons is difficult.However, in 1990, 6% <strong>of</strong> adults between ages 16-64 reported a disability that limits mobility or self-care.In 2000, 10% <strong>of</strong> the same population responded affirmatively to a similar question. For persons over age64, the percentage <strong>of</strong> disabled rose from 33% to 40% over the same time period.Household and Family CharacteristicsThe U.S. Census Bureau defines “household” asall the people who occupy a single housing unitas their usual place <strong>of</strong> residence. This includesfamilies, defined as a group <strong>of</strong> two or morepeople who reside together and who are relatedby birth, marriage, or adoption.From 1990 to 2000, the total number <strong>of</strong>households in the <strong>City</strong> grew from 24,173 to27,071. Over the same time period, averagehousehold size remained the same at 2 personsper household. Similarly, the average family sizeremained at 5.Figure 2-2: Population by AgeNumber <strong>of</strong> People25,00020,00015,00010,000Of the 12,450 families residing in <strong>Champaign</strong> in2000, 3,137, or 25%, are single parenthouseholds. Of the single parent households, 2,449 or 78%, are headed by a female. The number <strong>of</strong>5,0000Under1818-24 25-34 35-49 50-64 65+Age CohortSource: U.S. Census, 1990 and 2000Number <strong>of</strong> HouseholdsFigure 2-3: Household Growth and AverageHousehold Size3000025000200001500010000500001970 1980 1990 2000HouseholdsSource: US Census, 1990 and 2000Average Household Size19701980199020004.03.53.02.52.01.51.00.50.0Average Household SizeHousing Market Analysis 9
single parent households increased from 2,676 families in 1990 to 3,137 families in 2000, a 17%increase.Household and Family IncomeIn 1990, the <strong>City</strong>’s median household income was $22,967 and the median family income was $36,767.By 2000, the median household and family incomes increased to $32,795 and $52,628, a 43% increase inboth categories. Lower household incomes are most likely due to the high numbers <strong>of</strong> Universitystudents in the <strong>City</strong>’s population who fall under the definition <strong>of</strong> households, but would not be counted asfamilies.The increase in median household and familyFigure 2-3: <strong>City</strong>wide Median Family Incomeincomes in the <strong>City</strong> parallels median incomechanges on the national level, which also$120,000increased by 40% to 42% respectively over the$100,000decade. However, in both 1990 and 2000, the$80,000<strong>City</strong>’s median household income was lower than$60,000the national median. The national median$40,000household and family incomes in 1990 were$20,000$30,056 and $35,225 and increased to $41,994$-(40%) and $50,046 (42%) in 2000.2000 Median Family Income<strong>Plan</strong>ning AreaSource: U.S. Census, 2000<strong>City</strong>wideTo assess the “real” growth <strong>of</strong> household andfamily income over the decade, the 2000median incomes must be compared to the 1990values adjusted for inflation. The 1990 adjustedmedian household income is the equivalent <strong>of</strong>$30,857 in 2000 dollars. Comparing the 1990adjusted value to the 2000 median household income <strong>of</strong> $32,795, household income experienced realgrowth <strong>of</strong> 6% over the decade. Family incomes experienced a 7% growth, with the adjusted 1990median family income <strong>of</strong> $49,398 increasing to $52,628 by 2002.Between 1990 and 2000, the number <strong>of</strong> families living under the poverty level declined from 1,167 to1,021 families, or 9.4% <strong>of</strong> the total population to 8.2%. Female-headed families represented over half <strong>of</strong>the families living below the poverty level in 2000; however, the percentage <strong>of</strong> these households livingbelow the poverty level has also decreased since 1990 from 684 families to 670, but increasing from 59%<strong>of</strong> the families living under the poverty level to 67%.As shown in the figure above, the median family income in <strong>Plan</strong>ning Areas 1, 2, 3, 4, 7, 8, and 14 fallbelow the citywide average. <strong>Plan</strong>ning Area 3 is the University District, but the others are predominantlynon-student residential areas. <strong>Plan</strong>ning Area 2 has the lowest median income in the <strong>City</strong>.Employment1 2 3 4 5 6 7 8 9 1011121314151617<strong>Plan</strong>ning AreaThe civilian labor force includes those who are classified as employed or unemployed, but may notinclude students, homemakers, retired workers, seasonal workers, or people doing only incidental unpaidfamily work. In 1990, there was a 4.9% unemployment rate within the civilian labor force. According tothe Illinois Department <strong>of</strong> Employment Security, the unemployment rate declined to 2.3% in 2000. As <strong>of</strong>January <strong>2010</strong>, however, the unemployment rate for <strong>Champaign</strong> County was listed at an astonishing10.8% (Bureau <strong>of</strong> Labor Statistics). This high rate <strong>of</strong> unemployment impacts all areas <strong>of</strong> the housingmarket, but especially homelessness and rental.10 Housing Market Analysis
- Page 1 and 2: 2010-2014Consolidated Plan2010/11 A
- Page 3: This page intentionally left blank
- Page 11 and 12: This page intentionally left blankv
- Page 13 and 14: • Provide decent, affordable hous
- Page 15 and 16: homeless populations. The City cont
- Page 17 and 18: Summary of Citizen ParticipationDat
- Page 19 and 20: The City held three public hearings
- Page 21 and 22: Chapter 2Housing Market AnalysisCOM
- Page 23: compared to the remainder of the Ci
- Page 27 and 28: Census. The U.S. Census Bureau esti
- Page 29 and 30: Table 2-1: Housing Opportunity Inde
- Page 31 and 32: All but three planning areas have h
- Page 33 and 34: Loan Denial Rates by Race and Incom
- Page 35 and 36: • Additional affordable or subsid
- Page 37 and 38: 2014 Consolidated Plan and will be
- Page 39 and 40: Because the cost of homeownership i
- Page 41 and 42: The City will renew its marketing e
- Page 43 and 44: of Champaign programs, are meeting
- Page 45 and 46: At incomes of
- Page 47 and 48: in the long-term. The City will con
- Page 49 and 50: from a disabling condition (usually
- Page 51 and 52: Almost all of the agencies that pro
- Page 53 and 54: monies to provide housing assistanc
- Page 55 and 56: Discharge Coordination PolicyContin
- Page 57 and 58: provide structural modifications an
- Page 59 and 60: Persons with Developmental Disabili
- Page 61 and 62: entering substance abuse treatment
- Page 63 and 64: RESTORATION OR REVITALIZATION NEEDS
- Page 65 and 66: licensed day care facility, nursery
- Page 67 and 68: portion of the workshop is devoted
- Page 69 and 70: • 27 playgrounds• 24 outdoor te
- Page 71 and 72: Alley ConditionA majority of the Ci
- Page 73 and 74: - lack of a multi-year schedule for
- Page 75 and 76:
Redevelopment Initiatives - Commerc
- Page 77 and 78:
Job TrainingThe Champaign Consortiu
- Page 79 and 80:
improving their skills and career o
- Page 81 and 82:
The development that occurred as a
- Page 83 and 84:
organizations. The creation of the
- Page 85 and 86:
non-profits (such as Habitat for Hu
- Page 87 and 88:
Activities:1) Targeted Full Home Im
- Page 89 and 90:
creation and preservation of afford
- Page 91 and 92:
4) Employer Assisted Housing: Explo
- Page 93 and 94:
housing units are located. The City
- Page 95 and 96:
successful. These supportive servic
- Page 97 and 98:
3) Accessible New Construction: Pro
- Page 99 and 100:
3) Prevention Education: Reduce the
- Page 101 and 102:
Strategies:a) Maintain the safety a
- Page 103 and 104:
) Support programs that provide hig
- Page 105 and 106:
Activities:1) Neighborhood Small Gr
- Page 107 and 108:
The information collected through t
- Page 109 and 110:
addressing blighted properties owne
- Page 111 and 112:
Non-Housing Community Development A
- Page 113 and 114:
America Saves is designed to reinfo
- Page 115 and 116:
The Neighborhood Services Departmen
- Page 117 and 118:
Homeowner Investment X NetHOME inve
- Page 119 and 120:
impacts the housing market in terms
- Page 121 and 122:
FY 2010/11 AAP Chapter 3:Affordable
- Page 123 and 124:
) Improve the condition of rental p
- Page 125 and 126:
) Reduce other blighting influences
- Page 127 and 128:
with Champaign County Regional Plan
- Page 129 and 130:
Habitat for Humanity chapter to ide
- Page 131 and 132:
Inputs: $10,000 per lot is availabl
- Page 133 and 134:
service providers facilitate an eff
- Page 135 and 136:
make existing affordable units acce
- Page 137 and 138:
Objectives:a) Coordinate public and
- Page 139 and 140:
FY 2010/11 AAP Chapter 4:Non-Housin
- Page 141 and 142:
approximately 4,900 persons, over 5
- Page 143 and 144:
128 FY 2010/11 Annual Action Plan:
- Page 145 and 146:
Objectives:a) Support programs to e
- Page 147 and 148:
School Resource Officer Program: Fo
- Page 149 and 150:
associations registered with the Ci
- Page 151 and 152:
FY 2010/11 AAP Chapter 6:HUD CPMP P
- Page 153 and 154:
FY 2010/11 AAP Chapter 5:FY 2010/11
- Page 155 and 156:
L M HA c c o m p l . T y p e :I n c
- Page 157 and 158:
L M HA c c o m p l . T y p e :I m p
- Page 159 and 160:
L M HA c c o m p l . T y p e :I n c
- Page 161 and 162:
L M HA c c o m p l . T y p e :I m p
- Page 163 and 164:
L M HA c c o m p l . T y p e :I n c
- Page 165 and 166:
L M CA c c o m p l . T y p e :I m p
- Page 167 and 168:
N o t A p p l i c a b l eA c c o m
- Page 180 and 181:
Appendix AConsultation/Participatio
- Page 182 and 183:
Appendix B 167
- Page 184 and 185:
• Clear floor space (18” minimu
- Page 186 and 187:
Laundry Areas• Front loading wash
- Page 188 and 189:
Appendix DCity Approved Visitabilit
- Page 190 and 191:
Exception: This does not apply to p
- Page 192 and 193:
Cost Burden, Extreme (or Severe): T
- Page 194 and 195:
friction surfaces, or impact servic
- Page 196 and 197:
SRO: Single-Room Occupancy.Subsidiz
- Page 198 and 199:
Appendix FCitizen Participation Pla
- Page 200 and 201:
E. PUBLIC HEARINGSDuring the Consol
- Page 202 and 203:
- Submission of objections within 3
- Page 204 and 205:
-- The development of the Consolida
- Page 206 and 207:
Neighborhood Services DepartmentNei
- Page 208 and 209:
Kerri stated it needs to be under c
- Page 210 and 211:
longer be considered a pilot progra
- Page 212 and 213:
CHAMPAIGN CITY COUNCILRegular Counc
- Page 214 and 215:
AUDIENCE PARTICIPATION:Firefighter
- Page 216 and 217:
Appendix HAnti-DisplacementFOR Comm
- Page 218 and 219:
SECTION ISTEPS TO BE TAKEN TO MINIM
- Page 220 and 221:
SECTION IISTEPS TO BE TAKEN WHEN LO
- Page 222 and 223:
moderate income households that are
- Page 224 and 225:
SECTION IIISTEPS TO BE TAKEN WHEN C
- Page 226 and 227:
1. The lessor of the monthly cost o
- Page 228 and 229:
displacement, stating who will be r
- Page 230 and 231:
funding the project, or the displac
- Page 232 and 233:
Appendix AGLOSSARY OF TERMSBelow ar
- Page 234 and 235:
project is subject to the Uniform A
- Page 236 and 237:
Appendix BAPPEALSThe City of Champa
- Page 238 and 239:
Appendix COne for One Replacement P
- Page 240 and 241:
Appendix IHUD CPMP Needs Worksheets
- Page 242 and 243:
Table 1BSpecial Needs (Non-Homeless
- Page 244 and 245:
Table 2APriority Housing Needs/Inve
- Page 246 and 247:
Table 2BPriority NeedAcquisition of
- Page 248 and 249:
Housing Inventory Chart: Emergency
- Page 250 and 251:
Housing Inventory Chart: Safe Haven
- Page 252:
Housing Inventory Chart: Unmet Need