2010-2014 Consolidated Plan - City of Champaign
2010-2014 Consolidated Plan - City of Champaign
2010-2014 Consolidated Plan - City of Champaign

Create successful ePaper yourself
Turn your PDF publications into a flip-book with our unique Google optimized e-Paper software.
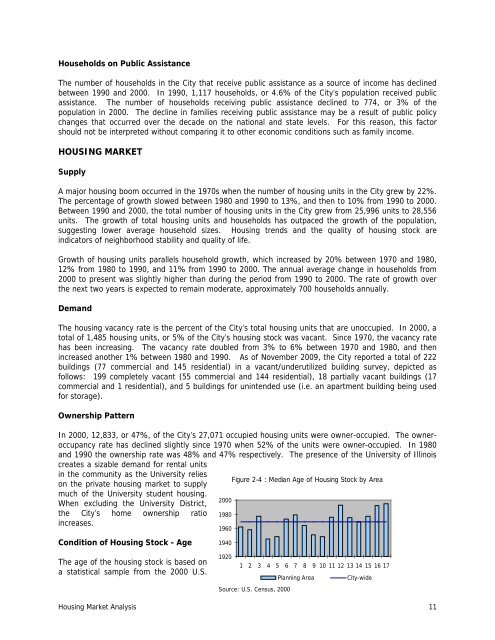
Households on Public AssistanceThe number <strong>of</strong> households in the <strong>City</strong> that receive public assistance as a source <strong>of</strong> income has declinedbetween 1990 and 2000. In 1990, 1,117 households, or 4.6% <strong>of</strong> the <strong>City</strong>’s population received publicassistance. The number <strong>of</strong> households receiving public assistance declined to 774, or 3% <strong>of</strong> thepopulation in 2000. The decline in families receiving public assistance may be a result <strong>of</strong> public policychanges that occurred over the decade on the national and state levels. For this reason, this factorshould not be interpreted without comparing it to other economic conditions such as family income.HOUSING MARKETSupplyA major housing boom occurred in the 1970s when the number <strong>of</strong> housing units in the <strong>City</strong> grew by 22%.The percentage <strong>of</strong> growth slowed between 1980 and 1990 to 13%, and then to 10% from 1990 to 2000.Between 1990 and 2000, the total number <strong>of</strong> housing units in the <strong>City</strong> grew from 25,996 units to 28,556units. The growth <strong>of</strong> total housing units and households has outpaced the growth <strong>of</strong> the population,suggesting lower average household sizes. Housing trends and the quality <strong>of</strong> housing stock areindicators <strong>of</strong> neighborhood stability and quality <strong>of</strong> life.Growth <strong>of</strong> housing units parallels household growth, which increased by 20% between 1970 and 1980,12% from 1980 to 1990, and 11% from 1990 to 2000. The annual average change in households from2000 to present was slightly higher than during the period from 1990 to 2000. The rate <strong>of</strong> growth overthe next two years is expected to remain moderate, approximately 700 households annually.DemandThe housing vacancy rate is the percent <strong>of</strong> the <strong>City</strong>’s total housing units that are unoccupied. In 2000, atotal <strong>of</strong> 1,485 housing units, or 5% <strong>of</strong> the <strong>City</strong>’s housing stock was vacant. Since 1970, the vacancy ratehas been increasing. The vacancy rate doubled from 3% to 6% between 1970 and 1980, and thenincreased another 1% between 1980 and 1990. As <strong>of</strong> November 2009, the <strong>City</strong> reported a total <strong>of</strong> 222buildings (77 commercial and 145 residential) in a vacant/underutilized building survey, depicted asfollows: 199 completely vacant (55 commercial and 144 residential), 18 partially vacant buildings (17commercial and 1 residential), and 5 buildings for unintended use (i.e. an apartment building being usedfor storage).Ownership PatternIn 2000, 12,833, or 47%, <strong>of</strong> the <strong>City</strong>’s 27,071 occupied housing units were owner-occupied. The owneroccupancyrate has declined slightly since 1970 when 52% <strong>of</strong> the units were owner-occupied. In 1980and 1990 the ownership rate was 48% and 47% respectively. The presence <strong>of</strong> the University <strong>of</strong> Illinoiscreates a sizable demand for rental unitsin the community as the University reliesFigure 2-4 : Median Age <strong>of</strong> Housing Stock by Areaon the private housing market to supplymuch <strong>of</strong> the University student housing.2000When excluding the University District,the <strong>City</strong>’s home ownership ratio 1980increases.Condition <strong>of</strong> Housing Stock - Age19601940The age <strong>of</strong> the housing stock is based ona statistical sample from the 2000 U.S.19201 2 3 4 5 6 7 8 9 10 11 12 13 14 15 16 17<strong>Plan</strong>ning Area<strong>City</strong>-wideSource: U.S. Census, 2000Housing Market Analysis 11