

Human Development Report 2013 - UNDP
Human Development Report 2013 - UNDP
Human Development Report 2013 - UNDP

You also want an ePaper? Increase the reach of your titles
YUMPU automatically turns print PDFs into web optimized ePapers that Google loves.
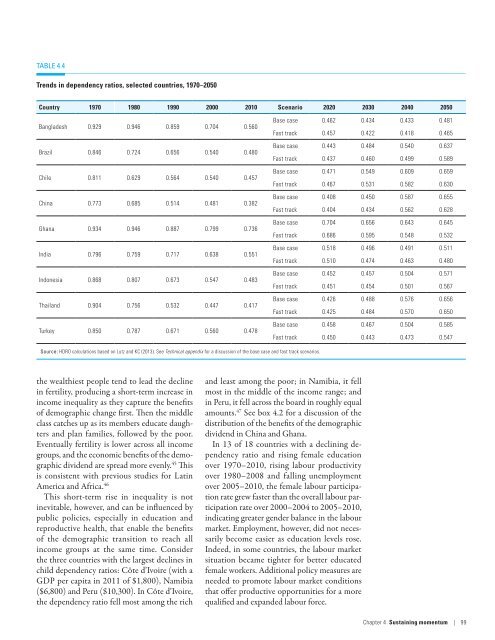
TABLE 4.4Trends in dependency ratios, selected countries, 1970–2050Country 1970 1980 1990 2000 2010 Scenario 2020 2030 2040 2050Bangladesh 0.929 0.946 0.859 0.704 0.560Brazil 0.846 0.724 0.656 0.540 0.480Chile 0.811 0.629 0.564 0.540 0.457China 0.773 0.685 0.514 0.481 0.382Ghana 0.934 0.946 0.887 0.799 0.736India 0.796 0.759 0.717 0.638 0.551Indonesia 0.868 0.807 0.673 0.547 0.483Thailand 0.904 0.756 0.532 0.447 0.417Turkey 0.850 0.787 0.671 0.560 0.478Base case 0.462 0.434 0.433 0.481Fast track 0.457 0.422 0.418 0.465Base case 0.443 0.484 0.540 0.637Fast track 0.437 0.460 0.499 0.589Base case 0.471 0.549 0.609 0.659Fast track 0.467 0.531 0.582 0.630Base case 0.408 0.450 0.587 0.655Fast track 0.404 0.434 0.562 0.628Base case 0.704 0.656 0.643 0.645Fast track 0.686 0.595 0.548 0.532Base case 0.518 0.496 0.491 0.511Fast track 0.510 0.474 0.463 0.480Base case 0.452 0.457 0.504 0.571Fast track 0.451 0.454 0.501 0.567Base case 0.426 0.488 0.576 0.656Fast track 0.425 0.484 0.570 0.650Base case 0.458 0.467 0.504 0.585Fast track 0.450 0.443 0.473 0.547Source: HDRO calculations based on Lutz and KC (<strong>2013</strong>). See Technical appendix for a discussion of the base case and fast track scenarios.the wealthiest people tend to lead the declinein fertility, producing a short-term increase inincome inequality as they capture the benefitsof demographic change first. Then the middleclass catches up as its members educate daughtersand plan families, followed by the poor.Eventually fertility is lower across all incomegroups, and the economic benefits of the demographicdividend are spread more evenly. 45 Thisis consistent with previous studies for LatinAmerica and Africa. 46This short-term rise in inequality is notinevitable, however, and can be influenced bypublic policies, especially in education andreproductive health, that enable the benefitsof the demographic transition to reach allincome groups at the same time. Considerthe three countries with the largest declines inchild dependency ratios: Côte d’Ivoire (with aGDP per capita in 2011 of $1,800), Namibia($6,800) and Peru ($10,300). In Côte d’Ivoire,the dependency ratio fell most among the richand least among the poor; in Namibia, it fellmost in the middle of the income range; andin Peru, it fell across the board in roughly equalamounts. 47 See box 4.2 for a discussion of thedistribution of the benefits of the demographicdividend in China and Ghana.In 13 of 18 countries with a declining dependencyratio and rising female educationover 1970–2010, rising labour productivityover 1980–2008 and falling unemploymentover 2005–2010, the female labour participationrate grew faster than the overall labour participationrate over 2000–2004 to 2005–2010,indicating greater gender balance in the labourmarket. Employment, however, did not necessarilybecome easier as education levels rose.Indeed, in some countries, the labour marketsituation became tighter for better educatedfemale workers. Additional policy measures areneeded to promote labour market conditionsthat offer productive opportunities for a morequalified and expanded labour force.Chapter 4 Sustaining momentum | 99


