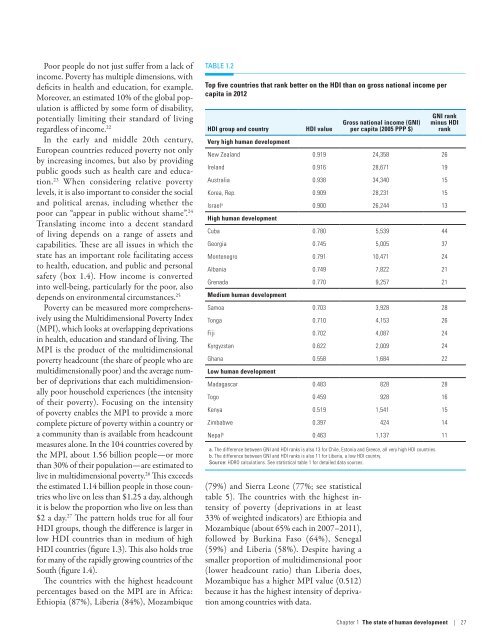
FIGURE 1.1Income per capita is rising to varying degrees in all four HDI groupsGross national income per capita (2005 PPP $)35,00030,00025,00020,00015,00010,0005,0000199019921994199619982000200220042006Note: PPP is purchasing power parity.Source: HDRO calculations based on a panel of the same 161 countries and territories.FIGURE 1.2Sub-Saharan Africa has sustained income growth over the last decadeGross national income per capita (2005 PPP $)2,1002,0001,9001,8001,7001,6001,5001,400199019921994Note: PPP is purchasing power parity.Source: HDRO calculations.1996199820002002200420082006201020082012Very high HDIHigh HDIMedium HDILow HDI20102012financial crisis—income per capita in theregion grew 5% a year, more than twice therate of the 1990s (figure 1.2). 18 This upwardtrend was led by resource-rich countries thatbenefited from price increases in Africa’s maincommodity exports—notably, gas, oil, mineralsand agricultural products—thanks mostly tostrong demand from the South, led by China.But growth was also widespread in othercountries, with strong performance amongmore diversified economies and agriculturebasedeconomies. Despite commodity priceincreases, many net commodity-importingcountries, such as Ethiopia, Rwanda andUganda, continued to grow fast. Sub-SaharanAfrican economies were also partly shieldedfrom global shocks by greater regional integration,particularly in East Africa.As most <strong>Human</strong> <strong>Development</strong> <strong>Report</strong>s haveunderscored, what matters is not only the levelof income, but also how that income is used. Asociety can spend its income on education oron weapons of war. Individuals can spend theirincome on essential foods or on narcotics. Forboth societies and individuals, what is decisiveis not the process of wealth maximization, buthow they choose to convert income into humandevelopment. Table 1.2 shows country successesin this respect, as measured by the largest positivedifference between GNI per capita and HDIranks. 19 New Zealand tops the list for very highhuman development countries, and Cuba topsthe list for high human development countries.PovertyOne of the world’s main priorities is to eradicatepoverty and hunger. This is the first ofthe eight Millennium <strong>Development</strong> Goals,for which the target for 2015 was to halve theproportion of people living on less than $1.25a day relative to 1990. This goal was achievedthree years before that target date, primarilybecause of the success of some of the most populouscountries: Brazil (where the percentageof the population living on less than 2005 PPP$1.25 a day went from 17.2% to 6.1%), China(from 60.2% to 13.1%) and India (from 49.4%to 32.7%). 20 As a result, many fewer people arepoor. For example, between 1990 and 2008,China alone lifted a remarkable 510 millionpeople out of poverty. 2126 | HUMAN DEVELOPMENT REPORT <strong>2013</strong>
Poor people do not just suffer from a lack ofincome. Poverty has multiple dimensions, withdeficits in health and education, for example.Moreover, an estimated 10% of the global populationis afflicted by some form of disability,potentially limiting their standard of livingregardless of income. 22In the early and middle 20th century,European countries reduced poverty not onlyby increasing incomes, but also by providingpublic goods such as health care and education.23 When considering relative povertylevels, it is also important to consider the socialand political arenas, including whether thepoor can “appear in public without shame”. 24Translating income into a decent standardof living depends on a range of assets andcapabilities. These are all issues in which thestate has an important role facilitating accessto health, education, and public and personalsafety (box 1.4). How income is convertedinto well-being, particularly for the poor, alsodepends on environmental circumstances. 25Poverty can be measured more comprehensivelyusing the Multidimensional Poverty Index(MPI), which looks at overlapping deprivationsin health, education and standard of living. TheMPI is the product of the multidimensionalpoverty headcount (the share of people who aremultidimensionally poor) and the average numberof deprivations that each multidimensionallypoor household experiences (the intensityof their poverty). Focusing on the intensityof poverty enables the MPI to provide a morecomplete picture of poverty within a country ora community than is available from headcountmeasures alone. In the 104 countries covered bythe MPI, about 1.56 billion people—or morethan 30% of their population—are estimated tolive in multidimensional poverty. 26 This exceedsthe estimated 1.14 billion people in those countrieswho live on less than $1.25 a day, althoughit is below the proportion who live on less than$2 a day. 27 The pattern holds true for all fourHDI groups, though the difference is larger inlow HDI countries than in medium of highHDI countries (figure 1.3). This also holds truefor many of the rapidly growing countries of theSouth (figure 1.4).The countries with the highest headcountpercentages based on the MPI are in Africa:Ethiopia (87%), Liberia (84%), MozambiqueTABLE 1.2Top five countries that rank better on the HDI than on gross national income percapita in 2012HDI group and countryVery high human developmentHDI value(79%) and Sierra Leone (77%; see statisticaltable 5). The countries with the highest intensityof poverty (deprivations in at least33% of weighted indicators) are Ethiopia andMozambique (about 65% each in 2007–2011),followed by Burkina Faso (64%), Senegal(59%) and Liberia (58%). Despite having asmaller proportion of multidimensional poor(lower headcount ratio) than Liberia does,Mozambique has a higher MPI value (0.512)because it has the highest intensity of deprivationamong countries with data.Gross national income (GNI)per capita (2005 PPP $)GNI rankminus HDIrankNew Zealand 0.919 24,358 26Ireland 0.916 28,671 19Australia 0.938 34,340 15Korea, Rep. 0.909 28,231 15Israel a 0.900 26,244 13High human developmentCuba 0.780 5,539 44Georgia 0.745 5,005 37Montenegro 0.791 10,471 24Albania 0.749 7,822 21Grenada 0.770 9,257 21Medium human developmentSamoa 0.703 3,928 28Tonga 0.710 4,153 26Fiji 0.702 4,087 24Kyrgyzstan 0.622 2,009 24Ghana 0.558 1,684 22Low human developmentMadagascar 0.483 828 28Togo 0.459 928 16Kenya 0.519 1,541 15Zimbabwe 0.397 424 14Nepal b 0.463 1,137 11a. The difference between GNI and HDI ranks is also 13 for Chile, Estonia and Greece, all very high HDI countries.b. The difference between GNI and HDI ranks is also 11 for Liberia, a low HDI country.Source: HDRO calculations. See statistical table 1 for detailed data sources.Chapter 1 The state of human development | 27
- Page 1 and 2: WNSEHuman DevelopmentReport 2013The
- Page 3 and 4: Human Development Report 2013The Ri
- Page 5 and 6: Human Development Report 2013 TeamD
- Page 7 and 8: Finally, the Report also calls for
- Page 9 and 10: Heather Simpson, Ben Slay, Mounir T
- Page 11 and 12: 3.6 India’s Supreme Court issues
- Page 13 and 14: OverviewOne of the most heartening
- Page 15 and 16: and sustainability are fully incorp
- Page 17 and 18: Without investment in people, retur
- Page 19 and 20: opportunity to reap the full benefi
- Page 21 and 22: Woods institutions, the United Nati
- Page 23 and 24: IntroductionWhen developed economie
- Page 25 and 26: leading economies—Brazil, China a
- Page 27 and 28: comparable access to information, e
- Page 29 and 30: mobile phones: cellular banking is
- Page 32 and 33: “The political problem ofmankind
- Page 34 and 35: BOX 1.1Fairness, macroeconomics and
- Page 36 and 37: BOX 1.3Amartya Sen, Nobel Laureate
- Page 40 and 41: BOX 1.4Subjective indicators of wel
- Page 42 and 43: FIGURE 1.4There is notable variatio
- Page 44 and 45: FIGURE 1.6Most regions show declini
- Page 46 and 47: Progress in humandevelopment achiev
- Page 48 and 49: BOX 1.7Social competencies: human d
- Page 50 and 51: TABLE 1.3Inequality and satisfactio
- Page 52 and 53: Not all countries havethe precondit
- Page 54 and 55: “When the music changes,so does t
- Page 56 and 57: BOX 2.1The South’s integration wi
- Page 58 and 59: FIGURE 2.1As a share of world merch
- Page 60 and 61: BOX 2.2Acquisitions by the South of
- Page 62 and 63: FIGURE 2.3Between 2000 and 2010, In
- Page 64 and 65: FIGURE 2.4Export earnings per capit
- Page 66 and 67: BOX 2.6Final assembly is about more
- Page 68 and 69: Instead of having a centreof indust
- Page 70 and 71: FIGURE 2.6Emerging market economies
- Page 72 and 73: Developing countriestrade more amon
- Page 74 and 75: “We cannot expect thatall nations
- Page 76 and 77: TABLE 3.1Selected developing countr
- Page 78 and 79: A common featureof countries thatha
- Page 80 and 81: More important thangetting prices r
- Page 82 and 83: BOX 3.5Eastern Europe and Central A
- Page 84 and 85: States have to beconscious that the
- Page 86 and 87: As countries develop,they tend to d
- Page 88 and 89:
Having weathered theAsian financial
- Page 90 and 91:
Providing publicservices that contr
- Page 92 and 93:
Advancing health requiresmore than
- Page 94 and 95:
Universal public healthand educatio
- Page 96 and 97:
• China. The Minimum Livelihood G
- Page 98 and 99:
“Each generation will reap whatth
- Page 100 and 101:
concerns will make for a complex en
- Page 102 and 103:
A greater emphasison education cans
- Page 104 and 105:
FIGURE 4.1Under the fast track scen
- Page 106 and 107:
Around the worldpeople are calling
- Page 108 and 109:
FIGURE 4.4Different environmental s
- Page 110 and 111:
FIGURE 4.5Education policies can al
- Page 112 and 113:
BOX 4.2China and Ghana: who benefit
- Page 114 and 115:
FIGURE 4.8countries thus converge t
- Page 116 and 117:
“Let us join hands to try tocreat
- Page 118 and 119:
Areas of globalinternational concer
- Page 120 and 121:
Addressing climatechange requires t
- Page 122 and 123:
International governanceis increasi
- Page 124 and 125:
BOX 5.2Jo Leinen, Member of the Eur
- Page 126 and 127:
facilitates reserve investments and
- Page 128 and 129:
Responsible sovereigntytakes the lo
- Page 130 and 131:
FIGURE 5.1Under the accelerated pro
- Page 132 and 133:
Good policymakingrequires greater f
- Page 134 and 135:
A fair and less unequalworld requir
- Page 137 and 138:
NotesOverview1 Atsmon and others 20
- Page 139 and 140:
25 Blinder 2006.26 UNIDO 2009.27 UN
- Page 141 and 142:
which is 61.7 deaths per 1,000 live
- Page 143 and 144:
ReferencesAbdurazakov, A., A. Minsa
- Page 145 and 146:
urban_world_cities_and_the_rise_of_
- Page 147 and 148:
Kamau, P., D. McCormick, and N. Pin
- Page 149 and 150:
Labor Administration. Geneva: Inter
- Page 151 and 152:
Human Development Report 2013The Ri
- Page 153 and 154:
Statistical acknowledgementsThe Rep
- Page 155 and 156:
Key to HDI countries and ranks, 201
- Page 157 and 158:
Human Development Report 2013The Ri
- Page 159 and 160:
Human Development Report 2013The Ri
- Page 161 and 162:
Human Development Report 2013The Ri
- Page 163 and 164:
Human Development Report 2013The Ri
- Page 165 and 166:
Human Development Report 2013The Ri
- Page 167 and 168:
Human Development Report 2013The Ri
- Page 169 and 170:
Human Development Report 2013The Ri
- Page 171 and 172:
Human Development Report 2013The Ri
- Page 173 and 174:
Human Development Report 2013The Ri
- Page 175 and 176:
Human Development Report 2013The Ri
- Page 177 and 178:
Human Development Report 2013The Ri
- Page 179 and 180:
Human Development Report 2013The Ri
- Page 181 and 182:
Human Development Report 2013The Ri
- Page 183 and 184:
Human Development Report 2013The Ri
- Page 185 and 186:
Human Development Report 2013The Ri
- Page 187 and 188:
Human Development Report 2013The Ri
- Page 189 and 190:
Human Development Report 2013The Ri
- Page 191 and 192:
Human Development Report 2013The Ri
- Page 193 and 194:
Human Development Report 2013The Ri
- Page 195 and 196:
Human Development Report 2013The Ri
- Page 197 and 198:
Human Development Report 2013The Ri
- Page 199 and 200:
Human Development Report 2013The Ri
- Page 201 and 202:
Human Development Report 2013The Ri
- Page 203 and 204:
Human Development Report 2013The Ri
- Page 205 and 206:
Human Development Report 2013The Ri
- Page 207 and 208:
Human Development Report 2013The Ri
- Page 209 and 210:
Human Development Report 2013The Ri
- Page 211 and 212:
Statistical referencesADB (Asian De
- Page 213 and 214:
Core features of the model pertinen
- Page 215 and 216:
Countries and HDI ranks in 2012 and