Human Development Report 2013 - UNDP
Human Development Report 2013 - UNDP
Human Development Report 2013 - UNDP
You also want an ePaper? Increase the reach of your titles
YUMPU automatically turns print PDFs into web optimized ePapers that Google loves.
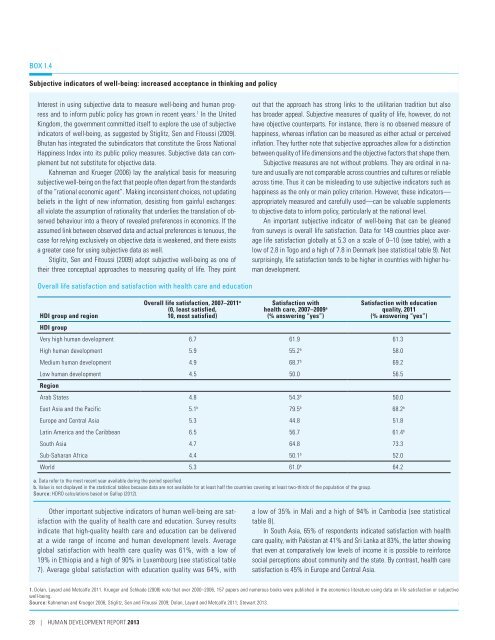
BOX 1.4Subjective indicators of well-being: increased acceptance in thinking and policyInterest in using subjective data to measure well-being and human progressand to inform public policy has grown in recent years. 1 In the UnitedKingdom, the government committed itself to explore the use of subjectiveindicators of well-being, as suggested by Stiglitz, Sen and Fitoussi (2009).Bhutan has integrated the subindicators that constitute the Gross NationalHappiness Index into its public policy measures. Subjective data can complementbut not substitute for objective data.Kahneman and Krueger (2006) lay the analytical basis for measuringsubjective well-being on the fact that people often depart from the standardsof the “rational economic agent”. Making inconsistent choices, not updatingbeliefs in the light of new information, desisting from gainful exchanges:all violate the assumption of rationality that underlies the translation of observedbehaviour into a theory of revealed preferences in economics. If theassumed link between observed data and actual preferences is tenuous, thecase for relying exclusively on objective data is weakened, and there existsa greater case for using subjective data as well.Stiglitz, Sen and Fitoussi (2009) adopt subjective well-being as one oftheir three conceptual approaches to measuring quality of life. They pointout that the approach has strong links to the utilitarian tradition but alsohas broader appeal. Subjective measures of quality of life, however, do nothave objective counterparts. For instance, there is no observed measure ofhappiness, whereas inflation can be measured as either actual or perceivedinflation. They further note that subjective approaches allow for a distinctionbetween quality of life dimensions and the objective factors that shape them.Subjective measures are not without problems. They are ordinal in natureand usually are not comparable across countries and cultures or reliableacross time. Thus it can be misleading to use subjective indicators such ashappiness as the only or main policy criterion. However, these indicators—appropriately measured and carefully used—can be valuable supplementsto objective data to inform policy, particularly at the national level.An important subjective indicator of well-being that can be gleanedfrom surveys is overall life satisfaction. Data for 149 countries place averagelife satisfaction globally at 5.3 on a scale of 0–10 (see table), with alow of 2.8 in Togo and a high of 7.8 in Denmark (see statistical table 9). Notsurprisingly, life satisfaction tends to be higher in countries with higher humandevelopment.Overall life satisfaction and satisfaction with health care and educationHDI group and regionHDI groupOverall life satisfaction, 2007–2011 a(0, least satisfied,10, most satisfied)Satisfaction withhealth care, 2007–2009 a(% answering “yes”)Satisfaction with educationquality, 2011(% answering “yes”)Very high human development 6.7 61.9 61.3High human development 5.9 55.2 b 58.0Medium human development 4.9 68.7 b 69.2Low human development 4.5 50.0 56.5RegionArab States 4.8 54.3 b 50.0East Asia and the Pacific 5.1 b 79.5 b 68.2 bEurope and Central Asia 5.3 44.8 51.8Latin America and the Caribbean 6.5 56.7 61.4 bSouth Asia 4.7 64.8 73.3Sub-Saharan Africa 4.4 50.1 b 52.0World 5.3 61.0 b 64.2a. Data refer to the most recent year available during the period specified.b. Value is not displayed in the statistical tables because data are not available for at least half the countries covering at least two-thirds of the population of the group.Source: HDRO calculations based on Gallup (2012).Other important subjective indicators of human well-being are satisfactionwith the quality of health care and education. Survey resultsindicate that high-quality health care and education can be deliveredat a wide range of income and human development levels. Averageglobal satisfaction with health care quality was 61%, with a low of19% in Ethiopia and a high of 90% in Luxembourg (see statistical table7). Average global satisfaction with education quality was 64%, witha low of 35% in Mali and a high of 94% in Cambodia (see statisticaltable 8).In South Asia, 65% of respondents indicated satisfaction with healthcare quality, with Pakistan at 41% and Sri Lanka at 83%, the latter showingthat even at comparatively low levels of income it is possible to reinforcesocial perceptions about community and the state. By contrast, health caresatisfaction is 45% in Europe and Central Asia.1. Dolan, Layard and Metcalfe 2011. Krueger and Schkade (2008) note that over 2000–2006, 157 papers and numerous books were published in the economics literature using data on life satisfaction or subjectivewell-being.Source: Kahneman and Krueger 2006; Stiglitz, Sen and Fitoussi 2009; Dolan, Layard and Metcalfe 2011; Stewart <strong>2013</strong>.28 | HUMAN DEVELOPMENT REPORT <strong>2013</strong>


