BOX 1.3Amartya Sen, Nobel Laureate in EconomicsWhat is it like to be a human being?Almost half a century ago, the philosopher Thomas Nagel published a famouspaper called “What Is It Like to Be a Bat?” The question I want to askis: what is it like to be a human being? As it happens, Tom Nagel’s insightfulpaper in The Philosophical Review was also really about human beings,and only marginally about bats. Among other points, Nagel expressed deepscepticism about the temptation of observational scientists to identify theexperience of being a bat—or similarly, a human being—with the associatedphysical phenomena in the brain and elsewhere in the body that arewithin easy reach of outside inspection. The sense of being a bat or a humancan hardly be seen as just having certain twitches in the brain and of thebody. The complexity of the former cannot be resolved by the easier tractabilityof the latter (tempting though it may be to do just that).The cutting edge of the human development approach is also based on adistinction —but of a rather different kind from Nagel’s basic epistemologicalcontrast. The approach that Mahbub ul Haq pioneered through the seriesof <strong>Human</strong> <strong>Development</strong> <strong>Report</strong>s which began in 1990 is that between, onthe one hand, the difficult problem of assessing the richness of human lives,including the freedoms that human beings have reason to value, and on theother, the much easier exercise of keeping track of incomes and other externalresources that persons—or nations—happen to have. Gross domesticproduct (GDP) is much easier to see and measure than the quality of humanlife that people have. But human well-being and freedom, and their connectionwith fairness and justice in the world, cannot be reduced simply to themeasurement of GDP and its growth rate, as many people are tempted to do.The intrinsic complexity of human development is important to acknowledge,partly because we should not be side-tracked into changing the question:that was the central point that moved Mahbub ul Haq’s bold initiative tosupplement—and to some extent supplant—GDP. But along with that camea more difficult point, which is also an inescapable part of what has cometo be called “the human development approach.” We may, for the sake ofconvenience, use many simple indicators of human development, such asthe HDI, based on only three variables with a very simple rule for weightingthem—but the quest cannot end there. We should not spurn workableand useful shortcuts—the HDI may tell us a lot more about human qualityof life than does the GDP—but nor should we be entirely satisfied with theimmediate gain captured in these shortcuts in a world of continuous practice.Assessing the quality of life is a much more complex exercise than what canbe captured through only one number, no matter how judicious is the selectionof variables to be included, and the choice of the procedure of weighting.The recognition of complexity has other important implications as well.The crucial role of public reasoning, which the present <strong>Human</strong> <strong>Development</strong><strong>Report</strong> particularly emphasizes, arises partly from the recognition of thiscomplexity. Only the wearer may know where the shoe pinches, but pinchavoidingarrangements cannot be effectively undertaken without givingvoice to the people and giving them extensive opportunities for publicdiscussion. The importance of various elements in evaluating well-beingand freedom of people can be adequately appreciated and assessed onlythrough persistent dialogue among the population, with an impact on themaking of public policy. The political significance of such initiatives as theso-called Arab Spring, and mass movements elsewhere in the world, ismatched by the epistemic importance of people expressing themselves, indialogue with others, on what ails their lives and what injustices they wantto remove. There is much to discuss—with each other and with the publicservants that make policy.The dialogic responsibilities, when properly appreciated across thelines of governance, must also include representing the interest of the peoplewho are not here to express their concerns in their own voice. <strong>Human</strong>development cannot be indifferent to future generations just because theyare not here—yet. But human beings do have the capacity to think aboutothers, and their lives, and the art of responsible and accountable politicsis to broaden dialogues from narrowly self-centred concerns to the broadersocial understanding of the importance of the needs and freedoms of peoplein the future as well as today. This is not a matter of simply including thoseconcerns within one single indicator—for example, by overcrowding thealready heavily loaded HDI (which stands, in any case, only for current wellbeingand freedom)—but it certainly is a matter of making sure that the discussionsof human development include those other concerns. The <strong>Human</strong><strong>Development</strong> <strong>Report</strong>s can continue to contribute to this broadening throughexplication as well as presenting tables of relevant information.The human development approach is a major advance in the difficultexercise of understanding the successes and deprivations of human lives,and in appreciating the importance of reflection and dialogue, and throughthat advancing fairness and justice in the world. We may be much like batsin not being readily accessible to the measuring rod of the impatient observationalscientist, but we are also capable of thinking and talking about themany- sided nature of our lives and those of others—today and tomorrow—in ways that may not be readily available to bats. Being a human being isboth like being a bat and very unlike it.regions saw notable improvement in all HDIcomponents, with faster progress in low andmedium HDI countries. East Asia and thePacific and South Asia saw continuing progressfrom earlier decades, while Sub-Saharan Africasaw more rapid progress in the last decade. Theconvergence in HDI values has become morepronounced in the last decade.One of the principal components of theHDI is life expectancy. In 2012, average life expectancywas 70.1 years, with wide differencesacross HDI groups: 59.1 years in low HDIcountries and 80.1 years in very high HDIcountries. Differences across countries areeven wider, with a low of 48.1 years in SierraLeone and a high of 83.6 years in Japan. In Sub-Saharan Africa, life expectancy stagnated at49.5 years between 1990 and 2000, a result ofthe HIV and AIDS pandemic. Between 2000and 2012, however, it increased 5.5 years.Another important influence on the HDI,and one of the most sensitive indicators of24 | HUMAN DEVELOPMENT REPORT <strong>2013</strong>
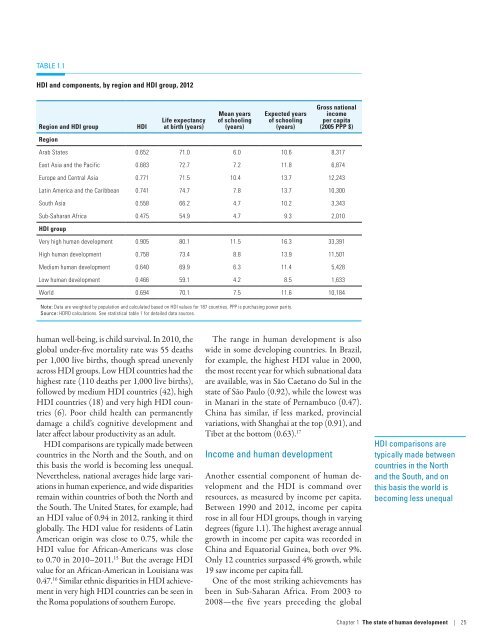
TABLE 1.1HDI and components, by region and HDI group, 2012Region and HDI groupRegionHDILife expectancyat birth (years)Mean yearsof schooling(years)Expected yearsof schooling(years)Gross nationalincomeper capita(2005 PPP $)Arab States 0.652 71.0 6.0 10.6 8,317East Asia and the Pacific 0.683 72.7 7.2 11.8 6,874Europe and Central Asia 0.771 71.5 10.4 13.7 12,243Latin America and the Caribbean 0.741 74.7 7.8 13.7 10,300South Asia 0.558 66.2 4.7 10.2 3,343Sub-Saharan Africa 0.475 54.9 4.7 9.3 2,010HDI groupVery high human development 0.905 80.1 11.5 16.3 33,391High human development 0.758 73.4 8.8 13.9 11,501Medium human development 0.640 69.9 6.3 11.4 5,428Low human development 0.466 59.1 4.2 8.5 1,633World 0.694 70.1 7.5 11.6 10,184Note: Data are weighted by population and calculated based on HDI values for 187 countries. PPP is purchasing power parity.Source: HDRO calculations. See statistical table 1 for detailed data sources.human well-being, is child survival. In 2010, theglobal under-five mortality rate was 55 deathsper 1,000 live births, though spread unevenlyacross HDI groups. Low HDI countries had thehighest rate (110 deaths per 1,000 live births),followed by medium HDI countries (42), highHDI countries (18) and very high HDI countries(6). Poor child health can permanentlydamage a child’s cognitive development andlater affect labour productivity as an adult.HDI comparisons are typically made betweencountries in the North and the South, and onthis basis the world is becoming less unequal.Nevertheless, national averages hide large variationsin human experience, and wide disparitiesremain within countries of both the North andthe South. The United States, for example, hadan HDI value of 0.94 in 2012, ranking it thirdglobally. The HDI value for residents of LatinAmerican origin was close to 0.75, while theHDI value for African-Americans was closeto 0.70 in 2010–2011. 15 But the average HDIvalue for an African-American in Louisiana was0.47. 16 Similar ethnic disparities in HDI achievementin very high HDI countries can be seen inthe Roma populations of southern Europe.The range in human development is alsowide in some developing countries. In Brazil,for example, the highest HDI value in 2000,the most recent year for which subnational dataare available, was in São Caetano do Sul in thestate of São Paulo (0.92), while the lowest wasin Manari in the state of Pernambuco (0.47).China has similar, if less marked, provincialvariations, with Shanghai at the top (0.91), andTibet at the bottom (0.63). 17Income and human developmentAnother essential component of human developmentand the HDI is command overresources, as measured by income per capita.Between 1990 and 2012, income per capitarose in all four HDI groups, though in varyingdegrees (figure 1.1). The highest average annualgrowth in income per capita was recorded inChina and Equatorial Guinea, both over 9%.Only 12 countries surpassed 4% growth, while19 saw income per capita fall.One of the most striking achievements hasbeen in Sub-Saharan Africa. From 2003 to2008—the five years preceding the globalHDI comparisons aretypically made betweencountries in the Northand the South, and onthis basis the world isbecoming less unequalChapter 1 The state of human development | 25
- Page 1 and 2: WNSEHuman DevelopmentReport 2013The
- Page 3 and 4: Human Development Report 2013The Ri
- Page 5 and 6: Human Development Report 2013 TeamD
- Page 7 and 8: Finally, the Report also calls for
- Page 9 and 10: Heather Simpson, Ben Slay, Mounir T
- Page 11 and 12: 3.6 India’s Supreme Court issues
- Page 13 and 14: OverviewOne of the most heartening
- Page 15 and 16: and sustainability are fully incorp
- Page 17 and 18: Without investment in people, retur
- Page 19 and 20: opportunity to reap the full benefi
- Page 21 and 22: Woods institutions, the United Nati
- Page 23 and 24: IntroductionWhen developed economie
- Page 25 and 26: leading economies—Brazil, China a
- Page 27 and 28: comparable access to information, e
- Page 29 and 30: mobile phones: cellular banking is
- Page 32 and 33: “The political problem ofmankind
- Page 34 and 35: BOX 1.1Fairness, macroeconomics and
- Page 38 and 39: FIGURE 1.1Income per capita is risi
- Page 40 and 41: BOX 1.4Subjective indicators of wel
- Page 42 and 43: FIGURE 1.4There is notable variatio
- Page 44 and 45: FIGURE 1.6Most regions show declini
- Page 46 and 47: Progress in humandevelopment achiev
- Page 48 and 49: BOX 1.7Social competencies: human d
- Page 50 and 51: TABLE 1.3Inequality and satisfactio
- Page 52 and 53: Not all countries havethe precondit
- Page 54 and 55: “When the music changes,so does t
- Page 56 and 57: BOX 2.1The South’s integration wi
- Page 58 and 59: FIGURE 2.1As a share of world merch
- Page 60 and 61: BOX 2.2Acquisitions by the South of
- Page 62 and 63: FIGURE 2.3Between 2000 and 2010, In
- Page 64 and 65: FIGURE 2.4Export earnings per capit
- Page 66 and 67: BOX 2.6Final assembly is about more
- Page 68 and 69: Instead of having a centreof indust
- Page 70 and 71: FIGURE 2.6Emerging market economies
- Page 72 and 73: Developing countriestrade more amon
- Page 74 and 75: “We cannot expect thatall nations
- Page 76 and 77: TABLE 3.1Selected developing countr
- Page 78 and 79: A common featureof countries thatha
- Page 80 and 81: More important thangetting prices r
- Page 82 and 83: BOX 3.5Eastern Europe and Central A
- Page 84 and 85: States have to beconscious that the
- Page 86 and 87:
As countries develop,they tend to d
- Page 88 and 89:
Having weathered theAsian financial
- Page 90 and 91:
Providing publicservices that contr
- Page 92 and 93:
Advancing health requiresmore than
- Page 94 and 95:
Universal public healthand educatio
- Page 96 and 97:
• China. The Minimum Livelihood G
- Page 98 and 99:
“Each generation will reap whatth
- Page 100 and 101:
concerns will make for a complex en
- Page 102 and 103:
A greater emphasison education cans
- Page 104 and 105:
FIGURE 4.1Under the fast track scen
- Page 106 and 107:
Around the worldpeople are calling
- Page 108 and 109:
FIGURE 4.4Different environmental s
- Page 110 and 111:
FIGURE 4.5Education policies can al
- Page 112 and 113:
BOX 4.2China and Ghana: who benefit
- Page 114 and 115:
FIGURE 4.8countries thus converge t
- Page 116 and 117:
“Let us join hands to try tocreat
- Page 118 and 119:
Areas of globalinternational concer
- Page 120 and 121:
Addressing climatechange requires t
- Page 122 and 123:
International governanceis increasi
- Page 124 and 125:
BOX 5.2Jo Leinen, Member of the Eur
- Page 126 and 127:
facilitates reserve investments and
- Page 128 and 129:
Responsible sovereigntytakes the lo
- Page 130 and 131:
FIGURE 5.1Under the accelerated pro
- Page 132 and 133:
Good policymakingrequires greater f
- Page 134 and 135:
A fair and less unequalworld requir
- Page 137 and 138:
NotesOverview1 Atsmon and others 20
- Page 139 and 140:
25 Blinder 2006.26 UNIDO 2009.27 UN
- Page 141 and 142:
which is 61.7 deaths per 1,000 live
- Page 143 and 144:
ReferencesAbdurazakov, A., A. Minsa
- Page 145 and 146:
urban_world_cities_and_the_rise_of_
- Page 147 and 148:
Kamau, P., D. McCormick, and N. Pin
- Page 149 and 150:
Labor Administration. Geneva: Inter
- Page 151 and 152:
Human Development Report 2013The Ri
- Page 153 and 154:
Statistical acknowledgementsThe Rep
- Page 155 and 156:
Key to HDI countries and ranks, 201
- Page 157 and 158:
Human Development Report 2013The Ri
- Page 159 and 160:
Human Development Report 2013The Ri
- Page 161 and 162:
Human Development Report 2013The Ri
- Page 163 and 164:
Human Development Report 2013The Ri
- Page 165 and 166:
Human Development Report 2013The Ri
- Page 167 and 168:
Human Development Report 2013The Ri
- Page 169 and 170:
Human Development Report 2013The Ri
- Page 171 and 172:
Human Development Report 2013The Ri
- Page 173 and 174:
Human Development Report 2013The Ri
- Page 175 and 176:
Human Development Report 2013The Ri
- Page 177 and 178:
Human Development Report 2013The Ri
- Page 179 and 180:
Human Development Report 2013The Ri
- Page 181 and 182:
Human Development Report 2013The Ri
- Page 183 and 184:
Human Development Report 2013The Ri
- Page 185 and 186:
Human Development Report 2013The Ri
- Page 187 and 188:
Human Development Report 2013The Ri
- Page 189 and 190:
Human Development Report 2013The Ri
- Page 191 and 192:
Human Development Report 2013The Ri
- Page 193 and 194:
Human Development Report 2013The Ri
- Page 195 and 196:
Human Development Report 2013The Ri
- Page 197 and 198:
Human Development Report 2013The Ri
- Page 199 and 200:
Human Development Report 2013The Ri
- Page 201 and 202:
Human Development Report 2013The Ri
- Page 203 and 204:
Human Development Report 2013The Ri
- Page 205 and 206:
Human Development Report 2013The Ri
- Page 207 and 208:
Human Development Report 2013The Ri
- Page 209 and 210:
Human Development Report 2013The Ri
- Page 211 and 212:
Statistical referencesADB (Asian De
- Page 213 and 214:
Core features of the model pertinen
- Page 215 and 216:
Countries and HDI ranks in 2012 and