Human Development Report 2013 - UNDP
Human Development Report 2013 - UNDP
Human Development Report 2013 - UNDP
Create successful ePaper yourself
Turn your PDF publications into a flip-book with our unique Google optimized e-Paper software.
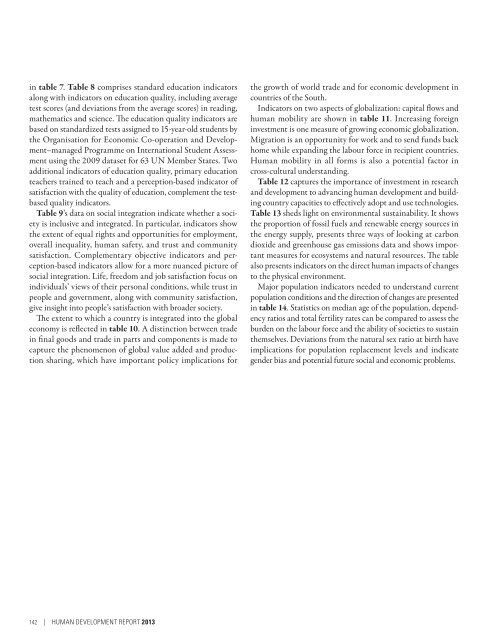
in table 7. Table 8 comprises standard education indicatorsalong with indicators on education quality, including averagetest scores (and deviations from the average scores) in reading,mathematics and science. The education quality indicators arebased on standardized tests assigned to 15-year-old students bythe Organisation for Economic Co-operation and <strong>Development</strong>–managedProgramme on International Student Assessmentusing the 2009 dataset for 63 UN Member States. Twoadditional indicators of education quality, primary educationteachers trained to teach and a perception-based indicator ofsatisfaction with the quality of education, complement the testbasedquality indicators.Table 9’s data on social integration indicate whether a societyis inclusive and integrated. In particular, indicators showthe extent of equal rights and opportunities for employment,overall inequality, human safety, and trust and communitysatisfaction. Complementary objective indicators and perception-basedindicators allow for a more nuanced picture ofsocial integration. Life, freedom and job satisfaction focus onindividuals’ views of their personal conditions, while trust inpeople and government, along with community satisfaction,give insight into people’s satisfaction with broader society.The extent to which a country is integrated into the globaleconomy is reflected in table 10. A distinction between tradein final goods and trade in parts and components is made tocapture the phenomenon of global value added and productionsharing, which have important policy implications forthe growth of world trade and for economic development incountries of the South.Indicators on two aspects of globalization: capital flows andhuman mobility are shown in table 11. Increasing foreigninvestment is one measure of growing economic globalization.Migration is an opportunity for work and to send funds backhome while expanding the labour force in recipient countries.<strong>Human</strong> mobility in all forms is also a potential factor incross-cultural understanding.Table 12 captures the importance of investment in researchand development to advancing human development and buildingcountry capacities to effectively adopt and use technologies.Table 13 sheds light on environmental sustainability. It showsthe proportion of fossil fuels and renewable energy sources inthe energy supply, presents three ways of looking at carbondioxide and greenhouse gas emissions data and shows importantmeasures for ecosystems and natural resources. The tablealso presents indicators on the direct human impacts of changesto the physical environment.Major population indicators needed to understand currentpopulation conditions and the direction of changes are presentedin table 14. Statistics on median age of the population, dependencyratios and total fertility rates can be compared to assess theburden on the labour force and the ability of societies to sustainthemselves. Deviations from the natural sex ratio at birth haveimplications for population replacement levels and indicategender bias and potential future social and economic problems.142 | <strong>Human</strong> <strong>Development</strong> <strong>Report</strong> <strong>2013</strong>


