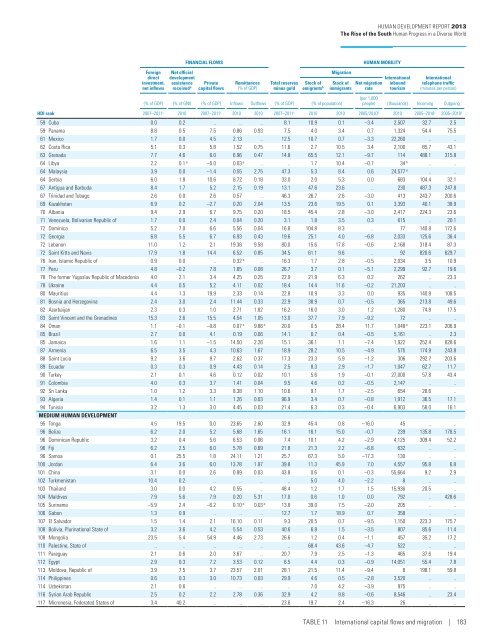
Table11International capital flows and migrationForeigndirectinvestment,net inflowsNet officialdevelopmentassistancereceived aFINANCIAL FLOWSPrivatecapital flowsRemittances(% of GDP)Total reservesminus goldStock ofemigrants bMigrationStock ofimmigrants(% of GDP) (% of GNI) (% of GDP) Inflows Outflows (% of GDP) (% of population)HUMAN MOBILITYNet migrationrateInternationalinboundtourismInternationaltelephone traffic(minutes per person)(per 1,000people) (thousands) Incoming OutgoingHDI rank 2007–2011 c 2010 2007–2011 c 2010 2010 2007–2011 c 2010 2010 2005/2010 d 2010 2005–2010 c 2005–2010 cVery high human development1 Norway 2.8 –1.1 –4.9 0.16 0.97 10.2 3.8 10.0 7.2 4,767 .. 241.92 Australia 2.7 –0.3 6.5 0.43 0.33 3.1 2.1 25.7 10.5 5,885 .. ..3 United States 1.5 –0.2 –0.2 0.04 0.36 0.9 0.8 13.5 3.3 59,791 82.5 237.14 Netherlands 1.9 –0.8 1.1 0.50 1.67 2.4 6.0 10.5 0.6 10,883 .. 96.55 Germany 1.1 –0.4 1.2 0.35 0.49 1.9 4.3 13.1 1.3 26,875 .. 182.56 New Zealand 0.5 –0.3 1.7 0.59 e 0.82 e 11.7 14.5 22.4 3.1 2,492 .. 173.37 Ireland 6.4 –0.5 25.3 0.29 0.85 0.6 16.1 19.6 4.6 7,189 .. 441.87 Sweden 2.3 –1.0 2.2 0.15 0.15 8.2 3.4 14.1 5.8 4,951 .. 160.59 Switzerland 0.4 –0.4 –9.0 0.49 4.09 44.0 5.4 23.2 4.8 8,628 .. 409.310 Japan 0.0 –0.2 0.7 0.03 0.08 21.4 0.6 1.7 0.4 8,611 13.8 ..11 Canada 2.4 –0.3 4.1 .. .. 3.8 3.5 21.3 6.6 16,097 .. ..12 Korea, Republic of 0.4 –0.1 –0.5 0.86 1.12 27.3 4.3 1.1 –0.1 8,798 22.2 47.713 Hong Kong, China (SAR) 34.1 .. –0.8 0.15 0.19 117.1 10.2 38.8 5.1 20,085 524.3 1,446.913 Iceland 7.2 –0.3 –55.2 0.20 0.10 60.1 13.0 11.3 6.8 1,213 233.1 148.015 Denmark 4.6 –0.9 –1.6 0.20 1.02 24.6 4.7 8.8 3.3 8,744 183.9 190.616 Israel 4.7 .. –0.2 0.65 1.72 30.8 14.0 40.4 7.8 2,803 .. ..17 Belgium 18.0 –0.6 –0.2 2.18 0.87 3.5 4.2 13.7 3.8 7,186 .. 255.018 Austria 3.3 –0.3 0.6 0.86 0.92 2.6 7.1 15.6 3.8 22,004 .. 171.618 Singapore 18.1 .. –1.4 .. .. 99.1 6.1 40.7 30.9 9,161 447.5 1,525.220 France 1.5 –0.5 10.8 0.61 0.21 1.8 2.8 10.7 1.6 77,148 182.1 192.121 Finland 0.0 –0.6 2.9 0.35 0.18 3.0 6.2 4.2 2.7 3,670 .. ..21 Slovenia 2.2 .. 6.8 0.66 0.34 1.7 6.5 8.1 2.2 1,869 f 88.2 112.023 Spain 1.7 .. –3.2 0.76 0.88 2.2 3.0 15.2 10.1 52,677 .. 118.924 Liechtenstein .. .. .. .. .. .. 17.1 34.6 .. 52 .. ..25 Italy 1.5 –0.2 –3.4 0.33 0.60 2.2 5.8 7.4 6.7 43,626 .. 152.026 Luxembourg 542.9 –1.1 214.8 2.99 19.69 1.5 11.8 35.2 17.6 849 810.6 822.526 United Kingdom 2.2 –0.6 –4.9 0.33 0.16 3.3 7.5 11.2 3.3 28,295 .. 147.528 Czech Republic 2.5 .. 2.1 0.57 0.92 18.4 3.6 4.4 4.6 8,185 120.1 50.529 Greece 0.6 .. –7.8 0.50 0.65 0.4 10.8 10.1 2.7 15,007 g 96.1 201.330 Brunei Darussalam 4.0 .. 4.3 .. 3.60 12.6 6.0 36.4 1.8 157 f .. ..31 Cyprus 1.0 .. 35.1 0.63 1.75 2.0 17.0 17.5 8.3 2,173 314.7 555.432 Malta 12.2 .. –42.2 0.58 0.56 5.6 26.2 3.8 2.4 1,332 .. 144.033 Andorra .. .. .. .. .. .. 10.7 64.4 .. 1,830 638.6 708.333 Estonia 0.8 .. 15.0 1.71 0.50 0.9 12.6 13.6 0.0 2,120 102.9 80.835 Slovakia 0.6 .. 1.4 1.83 0.08 0.9 9.6 2.4 1.3 1,298 h 137.2 140.636 Qatar 4.3 .. .. .. .. 9.4 0.7 86.5 132.9 1,866 422.7 484.837 Hungary 17.1 .. 6.5 1.76 0.98 34.8 4.6 3.7 1.5 9,510 116.2 48.238 Barbados 16.3 0.3 e 10.4 2.99 0.97 22.1 41.0 10.9 0.0 532 .. ..39 Poland 2.8 .. 4.9 1.62 0.34 18.0 8.3 2.2 0.3 12,470 .. 24.940 Chile 7.0 0.1 –0.3 0.00 0.00 16.9 3.7 1.9 0.4 2,766 26.2 12.241 Lithuania 2.9 .. 6.1 4.34 1.48 18.5 13.2 4.0 –2.1 1,507 75.1 34.441 United Arab Emirates 1.3 .. .. .. .. 10.3 1.2 70.0 106.3 7,126 .. 643.143 Portugal 4.3 –0.3 –3.8 1.56 0.62 0.8 20.8 8.6 2.8 6,756 f 173.9 111.244 Latvia 5.5 .. 2.9 2.56 0.18 21.2 12.3 15.0 –0.9 1,373 .. 94.145 Argentina 1.6 0.0 0.9 0.17 0.27 9.7 2.4 3.6 –1.0 5,325 .. 18.446 Seychelles 17.4 6.3 19.3 1.13 2.72 25.1 14.6 12.8 .. 175 64.7 111.347 Croatia 2.3 0.3 3.8 2.16 0.27 22.7 17.1 15.9 0.5 9,111 224.1 90.9High human development48 Bahrain 0.7 .. 19.9 .. 7.16 e 22.2 3.7 39.1 90.2 4,935 .. ..49 Bahamas 7.6 .. 7.1 .. 1.18 13.7 12.8 9.7 3.9 1,370 .. ..50 Belarus 7.2 0.3 8.7 0.68 0.19 10.9 18.4 11.4 –1.0 119 69.6 52.251 Uruguay 4.1 0.1 9.0 0.26 0.02 22.0 10.5 2.4 –3.0 2,353 76.2 46.352 Montenegro 18.5 2.0 .. 7.32 0.67 8.6 0.0 6.8 –0.8 1,088 .. ..52 Palau 1.4 19.5 .. .. .. .. 38.8 28.1 .. 84 179.9 205.154 Kuwait 0.1 .. –7.8 .. 9.47 e 14.6 8.5 68.8 22.2 207 .. ..55 Russian Federation 2.8 .. –1.7 0.35 1.26 24.4 7.9 8.7 1.6 22,281 .. ..56 Romania 1.5 .. 3.0 2.40 0.22 23.9 13.1 0.6 –0.9 7,575 105.4 ..57 Bulgaria 3.4 .. 2.2 2.91 0.05 28.5 16.0 1.4 –1.3 6,047 107.1 47.457 Saudi Arabia 2.8 .. –0.5 0.05 6.00 93.7 0.7 27.8 8.2 10,850 .. ..182 | HUMAN DevELoPMENt REPort <strong>2013</strong>
<strong>Human</strong> <strong>Development</strong> <strong>Report</strong> <strong>2013</strong>The Rise of the South <strong>Human</strong> Progress in a Diverse WorldForeigndirectinvestment,net inflowsNet officialdevelopmentassistancereceived aFINANCIAL FLOWSPrivatecapital flowsRemittances(% of GDP)Total reservesminus goldStock ofemigrants bMigrationStock ofimmigrants(% of GDP) (% of GNI) (% of GDP) Inflows Outflows (% of GDP) (% of population)HUMAN MOBILITYNet migrationrateInternationalinboundtourismInternationaltelephone traffic(minutes per person)(per 1,000people) (thousands) Incoming OutgoingHDI rank 2007–2011 c 2010 2007–2011 c 2010 2010 2007–2011 c 2010 2010 2005/2010 d 2010 2005–2010 c 2005–2010 c59 Cuba 0.0 0.2 .. .. .. 8.1 10.9 0.1 –3.4 2,507 32.7 2.559 Panama 8.8 0.5 7.5 0.86 0.93 7.5 4.0 3.4 0.7 1,324 54.4 75.561 Mexico 1.7 0.0 4.5 2.13 .. 12.5 10.7 0.7 –3.3 22,260 .. ..62 Costa Rica 5.1 0.3 5.8 1.52 0.75 11.6 2.7 10.5 3.4 2,100 85.7 43.163 Grenada 7.7 4.6 6.0 6.96 0.47 14.8 65.5 12.1 –9.7 114 488.1 315.864 Libya 2.2 0.1 e –5.0 0.03 e .. .. 1.7 10.4 –0.7 34 h .. ..64 Malaysia 3.9 0.0 –1.4 0.55 2.75 47.3 5.3 8.4 0.6 24,577 e .. ..64 Serbia 6.0 1.8 10.6 8.72 0.18 33.0 2.0 5.3 0.0 683 104.4 32.167 Antigua and Barbuda 8.4 1.7 5.2 2.15 0.19 13.1 47.6 23.6 .. 230 487.3 247.867 Trinidad and Tobago 2.6 0.0 2.6 0.57 .. 46.3 26.7 2.6 –3.0 413 243.7 200.669 Kazakhstan 6.9 0.2 –2.7 0.20 2.04 13.5 23.6 19.5 0.1 3,393 40.1 38.970 Albania 9.4 2.9 6.7 9.75 0.20 18.5 45.4 2.8 –3.0 2,417 224.3 23.671 Venezuela, Bolivarian Republic of 1.7 0.0 2.4 0.04 0.20 3.1 1.8 3.5 0.3 615 .. 20.172 Dominica 5.2 7.0 6.6 5.56 0.04 16.8 104.8 8.3 .. 77 140.8 172.672 Georgia 6.8 5.5 6.7 6.93 0.43 19.6 25.1 4.0 –6.8 2,033 125.6 36.472 Lebanon 11.0 1.2 2.1 19.38 9.58 80.0 15.6 17.8 –0.6 2,168 318.4 87.372 Saint Kitts and Nevis 17.9 1.8 14.4 6.52 0.85 34.5 61.1 9.6 .. 92 820.6 629.776 Iran, Islamic Republic of 0.9 0.0 .. 0.32 e .. 16.3 1.7 2.8 –0.5 2,034 3.5 10.977 Peru 4.8 –0.2 7.8 1.65 0.08 26.7 3.7 0.1 –5.1 2,299 92.7 19.678 The former Yugoslav Republic of Macedonia 4.0 2.1 3.4 4.25 0.25 22.9 21.9 6.3 0.2 262 .. 23.378 Ukraine 4.4 0.5 5.2 4.11 0.02 18.4 14.4 11.6 –0.2 21,203 .. ..80 Mauritius 4.4 1.3 19.9 2.33 0.14 22.8 10.9 3.3 0.0 935 140.8 108.581 Bosnia and Herzegovina 2.4 3.0 2.4 11.44 0.33 22.9 38.9 0.7 –0.5 365 213.8 49.682 Azerbaijan 2.3 0.3 1.0 2.71 1.82 16.2 16.0 3.0 1.2 1,280 74.8 17.583 Saint Vincent and the Grenadines 15.3 2.6 15.5 4.54 1.05 13.0 37.7 7.9 –9.2 72 .. ..84 Oman 1.1 –0.1 –0.8 0.07 e 9.86 e 20.0 0.5 28.4 11.7 1,048 e 223.1 206.985 Brazil 2.7 0.0 4.1 0.19 0.06 14.1 0.7 0.4 –0.5 5,161 .. 2.385 Jamaica 1.6 1.1 –1.5 14.50 2.26 15.1 36.1 1.1 –7.4 1,922 252.4 828.687 Armenia 6.5 3.5 4.3 10.63 1.67 18.9 28.2 10.5 –4.9 575 174.9 243.888 Saint Lucia 9.2 3.6 9.7 2.62 0.37 17.3 23.3 5.9 –1.2 306 292.7 203.689 Ecuador 0.3 0.3 0.9 4.43 0.14 2.5 8.3 2.9 –1.7 1,047 62.7 11.790 Turkey 2.1 0.1 4.6 0.12 0.02 10.1 5.6 1.9 –0.1 27,000 57.8 43.491 Colombia 4.0 0.3 3.7 1.41 0.04 9.5 4.6 0.2 –0.5 2,147 .. ..92 Sri Lanka 1.0 1.2 3.3 8.38 1.10 10.6 9.1 1.7 –2.5 654 28.6 ..93 Algeria 1.4 0.1 1.1 1.26 0.03 96.9 3.4 0.7 –0.8 1,912 36.5 17.194 Tunisia 3.2 1.3 3.0 4.45 0.03 21.4 6.3 0.3 –0.4 6,903 58.0 16.1Medium human development95 Tonga 4.5 19.5 0.0 23.65 2.60 32.9 45.4 0.8 –16.0 45 .. ..96 Belize 6.2 2.0 5.2 5.68 1.65 16.1 16.1 15.0 –0.7 239 135.8 178.596 Dominican Republic 3.2 0.4 5.6 6.53 0.06 7.4 10.1 4.2 –2.9 4,125 309.4 52.296 Fiji 6.2 2.5 6.0 5.78 0.69 21.8 21.3 2.2 –6.8 632 .. ..96 Samoa 0.1 25.5 1.8 24.11 1.21 25.7 67.3 5.0 –17.3 130 .. ..100 Jordan 6.4 3.6 6.0 13.78 1.87 39.8 11.3 45.9 7.0 4,557 95.8 6.8101 China 3.1 0.0 2.6 0.89 0.03 43.8 0.6 0.1 –0.3 55,664 9.2 2.9102 Turkmenistan 10.4 0.2 .. .. .. .. 5.0 4.0 –2.2 8 .. ..103 Thailand 3.0 0.0 4.2 0.55 .. 48.4 1.2 1.7 1.5 15,936 20.5 ..104 Maldives 7.9 5.6 7.9 0.20 5.31 17.0 0.6 1.0 0.0 792 .. 428.6105 Suriname –5.9 2.4 –6.2 0.10 e 0.03 e 13.8 39.0 7.5 –2.0 205 .. ..106 Gabon 1.3 0.9 .. .. .. 12.7 1.7 18.9 0.7 358 .. ..107 El Salvador 1.5 1.4 2.1 16.10 0.11 9.3 20.5 0.7 –9.5 1,150 223.3 175.7108 Bolivia, Plurinational State of 3.2 3.6 4.2 5.54 0.53 40.6 6.8 1.5 –3.5 807 85.6 11.4108 Mongolia 23.5 5.4 54.9 4.46 2.73 26.6 1.2 0.4 –1.1 457 35.2 17.2110 Palestine, State of .. .. .. .. .. .. 68.4 43.6 –4.7 522 .. ..111 Paraguay 2.1 0.6 2.0 3.67 .. 20.7 7.9 2.5 –1.3 465 37.6 19.4112 Egypt 2.9 0.3 7.2 3.53 0.12 6.5 4.4 0.3 –0.9 14,051 55.4 7.8113 Moldova, Republic of 3.9 7.5 3.7 23.57 2.01 28.1 21.5 11.4 –9.4 8 198.1 59.8114 Philippines 0.6 0.3 3.0 10.73 0.03 29.9 4.6 0.5 –2.8 3,520 .. ..114 Uzbekistan 2.1 0.6 .. .. .. .. 7.0 4.2 –3.9 975 .. ..116 Syrian Arab Republic 2.5 0.2 2.2 2.78 0.36 32.9 4.2 9.8 –0.6 8,546 .. 23.4117 Micronesia, Federated States of 3.4 40.2 .. .. .. 23.6 19.7 2.4 –16.3 26 .. ..Table 11 International capital flows and migration | 183
- Page 1 and 2:
WNSEHuman DevelopmentReport 2013The
- Page 3 and 4:
Human Development Report 2013The Ri
- Page 5 and 6:
Human Development Report 2013 TeamD
- Page 7 and 8:
Finally, the Report also calls for
- Page 9 and 10:
Heather Simpson, Ben Slay, Mounir T
- Page 11 and 12:
3.6 India’s Supreme Court issues
- Page 13 and 14:
OverviewOne of the most heartening
- Page 15 and 16:
and sustainability are fully incorp
- Page 17 and 18:
Without investment in people, retur
- Page 19 and 20:
opportunity to reap the full benefi
- Page 21 and 22:
Woods institutions, the United Nati
- Page 23 and 24:
IntroductionWhen developed economie
- Page 25 and 26:
leading economies—Brazil, China a
- Page 27 and 28:
comparable access to information, e
- Page 29 and 30:
mobile phones: cellular banking is
- Page 32 and 33:
“The political problem ofmankind
- Page 34 and 35:
BOX 1.1Fairness, macroeconomics and
- Page 36 and 37:
BOX 1.3Amartya Sen, Nobel Laureate
- Page 38 and 39:
FIGURE 1.1Income per capita is risi
- Page 40 and 41:
BOX 1.4Subjective indicators of wel
- Page 42 and 43:
FIGURE 1.4There is notable variatio
- Page 44 and 45:
FIGURE 1.6Most regions show declini
- Page 46 and 47:
Progress in humandevelopment achiev
- Page 48 and 49:
BOX 1.7Social competencies: human d
- Page 50 and 51:
TABLE 1.3Inequality and satisfactio
- Page 52 and 53:
Not all countries havethe precondit
- Page 54 and 55:
“When the music changes,so does t
- Page 56 and 57:
BOX 2.1The South’s integration wi
- Page 58 and 59:
FIGURE 2.1As a share of world merch
- Page 60 and 61:
BOX 2.2Acquisitions by the South of
- Page 62 and 63:
FIGURE 2.3Between 2000 and 2010, In
- Page 64 and 65:
FIGURE 2.4Export earnings per capit
- Page 66 and 67:
BOX 2.6Final assembly is about more
- Page 68 and 69:
Instead of having a centreof indust
- Page 70 and 71:
FIGURE 2.6Emerging market economies
- Page 72 and 73:
Developing countriestrade more amon
- Page 74 and 75:
“We cannot expect thatall nations
- Page 76 and 77:
TABLE 3.1Selected developing countr
- Page 78 and 79:
A common featureof countries thatha
- Page 80 and 81:
More important thangetting prices r
- Page 82 and 83:
BOX 3.5Eastern Europe and Central A
- Page 84 and 85:
States have to beconscious that the
- Page 86 and 87:
As countries develop,they tend to d
- Page 88 and 89:
Having weathered theAsian financial
- Page 90 and 91:
Providing publicservices that contr
- Page 92 and 93:
Advancing health requiresmore than
- Page 94 and 95:
Universal public healthand educatio
- Page 96 and 97:
• China. The Minimum Livelihood G
- Page 98 and 99:
“Each generation will reap whatth
- Page 100 and 101:
concerns will make for a complex en
- Page 102 and 103:
A greater emphasison education cans
- Page 104 and 105:
FIGURE 4.1Under the fast track scen
- Page 106 and 107:
Around the worldpeople are calling
- Page 108 and 109:
FIGURE 4.4Different environmental s
- Page 110 and 111:
FIGURE 4.5Education policies can al
- Page 112 and 113:
BOX 4.2China and Ghana: who benefit
- Page 114 and 115:
FIGURE 4.8countries thus converge t
- Page 116 and 117:
“Let us join hands to try tocreat
- Page 118 and 119:
Areas of globalinternational concer
- Page 120 and 121:
Addressing climatechange requires t
- Page 122 and 123:
International governanceis increasi
- Page 124 and 125:
BOX 5.2Jo Leinen, Member of the Eur
- Page 126 and 127:
facilitates reserve investments and
- Page 128 and 129:
Responsible sovereigntytakes the lo
- Page 130 and 131:
FIGURE 5.1Under the accelerated pro
- Page 132 and 133:
Good policymakingrequires greater f
- Page 134 and 135:
A fair and less unequalworld requir
- Page 137 and 138:
NotesOverview1 Atsmon and others 20
- Page 139 and 140:
25 Blinder 2006.26 UNIDO 2009.27 UN
- Page 141 and 142:
which is 61.7 deaths per 1,000 live
- Page 143 and 144: ReferencesAbdurazakov, A., A. Minsa
- Page 145 and 146: urban_world_cities_and_the_rise_of_
- Page 147 and 148: Kamau, P., D. McCormick, and N. Pin
- Page 149 and 150: Labor Administration. Geneva: Inter
- Page 151 and 152: Human Development Report 2013The Ri
- Page 153 and 154: Statistical acknowledgementsThe Rep
- Page 155 and 156: Key to HDI countries and ranks, 201
- Page 157 and 158: Human Development Report 2013The Ri
- Page 159 and 160: Human Development Report 2013The Ri
- Page 161 and 162: Human Development Report 2013The Ri
- Page 163 and 164: Human Development Report 2013The Ri
- Page 165 and 166: Human Development Report 2013The Ri
- Page 167 and 168: Human Development Report 2013The Ri
- Page 169 and 170: Human Development Report 2013The Ri
- Page 171 and 172: Human Development Report 2013The Ri
- Page 173 and 174: Human Development Report 2013The Ri
- Page 175 and 176: Human Development Report 2013The Ri
- Page 177 and 178: Human Development Report 2013The Ri
- Page 179 and 180: Human Development Report 2013The Ri
- Page 181 and 182: Human Development Report 2013The Ri
- Page 183 and 184: Human Development Report 2013The Ri
- Page 185 and 186: Human Development Report 2013The Ri
- Page 187 and 188: Human Development Report 2013The Ri
- Page 189 and 190: Human Development Report 2013The Ri
- Page 191 and 192: Human Development Report 2013The Ri
- Page 193: Human Development Report 2013The Ri
- Page 197 and 198: Human Development Report 2013The Ri
- Page 199 and 200: Human Development Report 2013The Ri
- Page 201 and 202: Human Development Report 2013The Ri
- Page 203 and 204: Human Development Report 2013The Ri
- Page 205 and 206: Human Development Report 2013The Ri
- Page 207 and 208: Human Development Report 2013The Ri
- Page 209 and 210: Human Development Report 2013The Ri
- Page 211 and 212: Statistical referencesADB (Asian De
- Page 213 and 214: Core features of the model pertinen
- Page 215 and 216: Countries and HDI ranks in 2012 and