- Page 1 and 2: Fiscal 2011 Registration Document
- Page 3 and 4: Registration Document Fiscal 2011 T
- Page 5 and 6: P ◀ CONTENTS ▶ Message from Mic
- Page 7 and 8: P ◀ CONTENTS ▶ History 01 01 Ou
- Page 9 and 10: P ◀ CONTENTS ▶ The Fundamental
- Page 11 and 12: P ◀ CONTENTS ▶ OUR MISSION Our
- Page 13 and 14: P ◀ CONTENTS ▶ ‡ Our ambition
- Page 15 and 16: P ◀ CONTENTS ▶ Titre Our Group
- Page 17 and 18: P ◀ CONTENTS ▶ SODEXO HAS THREE
- Page 19 and 20: P ◀ CONTENTS ▶ OUR AWARDS Sodex
- Page 21: P ◀ CONTENTS ▶ 2. EMPLOYEES AND
- Page 25 and 26: P ◀ CONTENTS ▶ Titre Quality 1
- Page 27 and 28: P ◀ CONTENTS ▶ Quality of Life
- Page 29 and 30: P ◀ CONTENTS ▶ diverse data sou
- Page 31 and 32: P ◀ CONTENTS ▶ commitments unde
- Page 33 and 34: P ◀ CONTENTS ▶ The high economi
- Page 35 and 36: P ◀ CONTENTS ▶ Democratic Repub
- Page 37 and 38: P ◀ CONTENTS ▶ 5.3 Achievements
- Page 39 and 40: P ◀ CONTENTS ▶ 6.2 Market trend
- Page 41 and 42: P ◀ CONTENTS ▶ 8. EDUCATION 21.
- Page 43 and 44: P ◀ CONTENTS ▶ Liceo Franco Arg
- Page 45 and 46: P ◀ CONTENTS ▶ Quality of Life
- Page 47 and 48: P ◀ CONTENTS ▶ themselves, enha
- Page 49 and 50: P ◀ CONTENTS ▶ 4. PUBLIC BENEFI
- Page 51 and 52: P ◀ CONTENTS ▶ Development of n
- Page 53 and 54: P ◀ CONTENTS ▶ Economic and Soc
- Page 55 and 56: P ◀ CONTENTS ▶ On the strength
- Page 57 and 58: P ◀ CONTENTS ▶ The proportion o
- Page 59 and 60: P ◀ CONTENTS ▶ Non-site manager
- Page 61 and 62: P ◀ CONTENTS ▶ 2.2.8 Social and
- Page 63 and 64: P ◀ CONTENTS ▶ 3. EMPLOYMENT IN
- Page 65 and 66: P ◀ CONTENTS ▶ The Better Tomor
- Page 67 and 68: P ◀ CONTENTS ▶ 2. WE DO The Bet
- Page 69 and 70: P ◀ CONTENTS ▶ 2.2 Supporting L
- Page 71 and 72: P ◀ CONTENTS ▶ chemical sourcin
- Page 73 and 74:
P ◀ CONTENTS ▶ EXAMPLES OF A BE
- Page 75 and 76:
P ◀ CONTENTS ▶ Titre Consolidat
- Page 77 and 78:
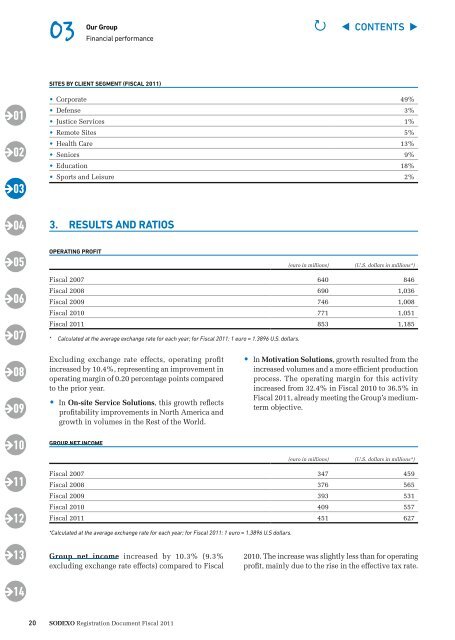
P ◀ CONTENTS ▶ 1.2 Operating pr
- Page 79 and 80:
P ◀ CONTENTS ▶ 2. FISCAL 2011 F
- Page 81 and 82:
P ◀ CONTENTS ▶ 2.2.2 Currency e
- Page 83 and 84:
P ◀ CONTENTS ▶ Partnership to b
- Page 85 and 86:
P ◀ CONTENTS ▶ 2.2.4 Motivation
- Page 87 and 88:
P ◀ CONTENTS ▶ Net cash used in
- Page 89 and 90:
P ◀ CONTENTS ▶ In the medium te
- Page 91 and 92:
P ◀ CONTENTS ▶ Consolidated inf
- Page 93 and 94:
P ◀ CONTENTS ▶ LIABILITIES AND
- Page 95 and 96:
P ◀ CONTENTS ▶ Consolidated inf
- Page 97 and 98:
P ◀ CONTENTS ▶ Consolidated inf
- Page 99 and 100:
P ◀ CONTENTS ▶ Companies in whi
- Page 101 and 102:
P ◀ CONTENTS ▶ of the date of a
- Page 103 and 104:
P ◀ CONTENTS ▶ ownership by the
- Page 105 and 106:
P ◀ CONTENTS ▶ tested for impai
- Page 107 and 108:
P ◀ CONTENTS ▶ If benefits unde
- Page 109 and 110:
P ◀ CONTENTS ▶ 2.22.3 Income ta
- Page 111 and 112:
P ◀ CONTENTS ▶ Fiscal 2010 (in
- Page 113 and 114:
P ◀ CONTENTS ▶ 4.2 Finance inco
- Page 115 and 116:
P ◀ CONTENTS ▶ 4.5 Property, pl
- Page 117 and 118:
P ◀ CONTENTS ▶ (in millions of
- Page 119 and 120:
P ◀ CONTENTS ▶ 4.8 Client inves
- Page 121 and 122:
P ◀ CONTENTS ▶ The table below
- Page 123 and 124:
P ◀ CONTENTS ▶ 4.11 Financial a
- Page 125 and 126:
P ◀ CONTENTS ▶ 4.11.4 details o
- Page 127 and 128:
P ◀ CONTENTS ▶ Consolidated inf
- Page 129 and 130:
P ◀ CONTENTS ▶ For borrowings o
- Page 131 and 132:
P ◀ CONTENTS ▶ 2011. These two
- Page 133 and 134:
P ◀ CONTENTS ▶ Currency derivat
- Page 135 and 136:
P ◀ CONTENTS ▶ Amounts shown in
- Page 137 and 138:
P ◀ CONTENTS ▶ Consolidated inf
- Page 139 and 140:
P ◀ CONTENTS ▶ 4.19 Provisions
- Page 141 and 142:
P ◀ CONTENTS ▶ 4.21 Deferred ta
- Page 143 and 144:
P ◀ CONTENTS ▶ Financial assets
- Page 145 and 146:
P ◀ CONTENTS ▶ The expected lif
- Page 147 and 148:
P ◀ CONTENTS ▶ Consolidated inf
- Page 149 and 150:
P ◀ CONTENTS ▶ 4.26.2 Principal
- Page 151 and 152:
P ◀ CONTENTS ▶ 5.1.1 Analysis o
- Page 153 and 154:
P ◀ CONTENTS ▶ Counterparty ris
- Page 155 and 156:
P ◀ CONTENTS ▶ France Consolida
- Page 157 and 158:
P ◀ CONTENTS ▶ Africa Consolida
- Page 159 and 160:
P ◀ CONTENTS ▶ europe Consolida
- Page 161 and 162:
P ◀ CONTENTS ▶ Asia, Pacific, M
- Page 163 and 164:
P ◀ CONTENTS ▶ Consolidated inf
- Page 165 and 166:
P ◀ CONTENTS ▶ ‡ Supplemental
- Page 167 and 168:
P ◀ CONTENTS ▶ ISo Code Countri
- Page 169 and 170:
P ◀ CONTENTS ▶ Growth in the Mo
- Page 171 and 172:
P ◀ CONTENTS ▶ At the same time
- Page 173 and 174:
P ◀ CONTENTS ▶ Information Titr
- Page 175 and 176:
P ◀ CONTENTS ▶ 2. BALANCE SHEET
- Page 177 and 178:
P ◀ CONTENTS ▶ 2.1.2 Property,
- Page 179 and 180:
P ◀ CONTENTS ▶ 5. EXCEPTIONAL I
- Page 181 and 182:
P ◀ CONTENTS ▶ Information on t
- Page 183 and 184:
P ◀ CONTENTS ▶ 13.2 Changes in
- Page 185 and 186:
P ◀ CONTENTS ▶ extendable on ap
- Page 187 and 188:
P ◀ CONTENTS ▶ 18. RELATED PART
- Page 189 and 190:
P ◀ CONTENTS ▶ Information on t
- Page 191 and 192:
P ◀ CONTENTS ▶ 26. CONSOLIDATIO
- Page 193 and 194:
P ◀ CONTENTS ▶ (in thousands of
- Page 195 and 196:
P ◀ CONTENTS ▶ III - Specific v
- Page 197 and 198:
P ◀ CONTENTS ▶ Information on t
- Page 199 and 200:
P ◀ CONTENTS ▶ (in euro) employ
- Page 201 and 202:
P ◀ CONTENTS ▶ Titre Legal 1Inf
- Page 203 and 204:
P ◀ CONTENTS ▶ 1.6 Registration
- Page 205 and 206:
P ◀ CONTENTS ▶ Legal Informatio
- Page 207 and 208:
P ◀ CONTENTS ▶ 2.4.2 Share owne
- Page 209 and 210:
P ◀ CONTENTS ▶ 2.5.2 Internatio
- Page 211 and 212:
P ◀ CONTENTS ▶ Shareholders - T
- Page 213 and 214:
P ◀ CONTENTS ▶ 2.3 Publication
- Page 215 and 216:
P ◀ CONTENTS ▶ 8. BENEFITS OF B
- Page 217 and 218:
P ◀ CONTENTS ▶ ADJUSTED SODEXO
- Page 219 and 220:
P ◀ CONTENTS ▶ ‡ Capital 1. S
- Page 221 and 222:
P ◀ CONTENTS ▶ 3. STOCK MARKET
- Page 223 and 224:
P ◀ CONTENTS ▶ Titre Corporate
- Page 225 and 226:
P ◀ CONTENTS ▶ 1.1 Composition
- Page 227 and 228:
P ◀ CONTENTS ▶ • Board Member
- Page 229 and 230:
P ◀ CONTENTS ▶ Other positions
- Page 231 and 232:
P ◀ CONTENTS ▶ Peter Thompson B
- Page 233 and 234:
P ◀ CONTENTS ▶ 2.3 Mission of t
- Page 235 and 236:
P ◀ CONTENTS ▶ The Audit Commit
- Page 237 and 238:
P ◀ CONTENTS ▶ Board has begun
- Page 239 and 240:
P ◀ CONTENTS ▶ 3.2 Group Polici
- Page 241 and 242:
P ◀ CONTENTS ▶ 3.2.5 Informatio
- Page 243 and 244:
P ◀ CONTENTS ▶ Executive Commit
- Page 245 and 246:
P ◀ CONTENTS ▶ 3.8.1 The risk i
- Page 247 and 248:
P ◀ CONTENTS ▶ Corporate Govern
- Page 249 and 250:
P ◀ CONTENTS ▶ Corporate Govern
- Page 251 and 252:
P ◀ CONTENTS ▶ ‡ Compensation
- Page 253 and 254:
P ◀ CONTENTS ▶ SUMMARY OF COMPE
- Page 255 and 256:
P ◀ CONTENTS ▶ 2. COMPENSATION
- Page 257 and 258:
P ◀ CONTENTS ▶ Total compensati
- Page 259 and 260:
P ◀ CONTENTS ▶ expiration date
- Page 261 and 262:
P ◀ CONTENTS ▶ expiration date
- Page 263 and 264:
P ◀ CONTENTS ▶ expiration date
- Page 265 and 266:
P ◀ CONTENTS ▶ exercise price (
- Page 267 and 268:
P ◀ CONTENTS ▶ Name date of Boa
- Page 269 and 270:
P ◀ CONTENTS ▶ ‡ Audit fees (
- Page 271 and 272:
P ◀ CONTENTS ▶ Combined Annual
- Page 273 and 274:
P ◀ CONTENTS ▶ It is therefore
- Page 275 and 276:
P ◀ CONTENTS ▶ trading sessions
- Page 277 and 278:
P ◀ CONTENTS ▶ Combined Annual
- Page 279 and 280:
P ◀ CONTENTS ▶ Combined annual
- Page 281 and 282:
P ◀ CONTENTS ▶ Combined Annual
- Page 283 and 284:
P ◀ CONTENTS ▶ Combined Annual
- Page 285 and 286:
P ◀ CONTENTS ▶ Combined Annual
- Page 287 and 288:
P ◀ CONTENTS ▶ Combined Annual
- Page 289 and 290:
P ◀ CONTENTS ▶ Combined Annual
- Page 291 and 292:
P ◀ CONTENTS ▶ Titre Glossary 1
- Page 293 and 294:
P ◀ CONTENTS ▶ Intensity risk R
- Page 295 and 296:
P ◀ CONTENTS ▶ P ◀ CONTENTS
- Page 297 and 298:
P ◀ CONTENTS ▶ Responsibility f
- Page 299 and 300:
P ◀ CONTENTS ▶ Titre Reconcilia
- Page 301 and 302:
P ◀ CONTENTS ▶ Reconciliation t
- Page 303 and 304:
PEFC/10-31-1190 FCBA/08-00860A Publ