<strong>Ministry</strong> <strong>of</strong> <strong>Finance</strong> <strong>and</strong> <strong>Planning</strong> Sri Lanka > <strong>Annual</strong> <strong>Report</strong> <strong>2010</strong>Statement <strong>of</strong> Financial Positionas at 31st December, <strong>2010</strong>ActualNotes <strong>2010</strong>Rs.2009Rs.Financial AssetsLoans to Public Officers 16 25,695,785,833 24,079,331,422Advances to Government Departments 17 8,337,309,856 8,155,189,267Membership Fees Paid 18 3,517,179,874 3,517,179,875On Lending 19 273,906,129,356 281,139,527,424Capital Contribution in State Owned Enterprises 20 121,865,113,583 116,666,827,054Remittance Account for Crown Agent 13,046,811 -Stamp Stock Account 994,659,879 -Total Financial Assets 434,329,225,192 433,558,055,042LiabilitiesBank Overdrafts 21 58,278,914,237 65,070,406,257Advances from the Central Bank 22 77,878,822,800 73,880,500,000Foreign Loan Revolving Funds 23 21,455,287,347 22,177,279,135Miscellaneous Funds 24 2,098,246,350 2,299,909,566Government Borrowings 25 4,099,414,489,679 3,657,463,431,775Deposits <strong>and</strong> Other Liabilities 26 75,963,233,860 75,061,352,776Operating Accounts with Government Departments 27 1,013,041,844 3,170,227,898Sundry Accounts 28 (2,462,511,689) (1,669,688,660)Total Liabilities 4,333,639,524,428 3,897,453,418,746Contingency Fund 140,000,000 140,000,000Total Liabilities & Contingency Fund Balance 4,333,779,524,428 3,897,593,418,746Total Liabilities <strong>and</strong> Contingency FundBalance over Financial Assets 3,899,450,299,236 3,464,035,363,704Consolidated Fund - Accumulated Deficit 29 196,423,775,459 204,995,009,372Total Investments in Physical Assets <strong>and</strong>Accumulated Net Revenue Deficit 30 3,703,026,523,777 3,259,040,354,3323,899,450,299,236 3,464,035,363,704Contingencies & Commitments 31 230,825,250,000 182,656,870,000The accompanying ”Statement <strong>of</strong> Accounting Policies” <strong>and</strong> ”Notes” to Financial Statements form an integral part <strong>of</strong> theseFinancial Statements. The Department <strong>of</strong> State Accounts is responsible for the preparation <strong>and</strong> presentation <strong>of</strong> theseFinancial Statements.N.G. DAYARATNEDirector GeneralDepartment <strong>of</strong> State AccountsP.B. JAYASUNDERASecretary, <strong>Ministry</strong> <strong>of</strong> <strong>Finance</strong> & <strong>Planning</strong>,<strong>and</strong> Secretary to the TreasuryGeneral TreasuryColombo 015 th April, 2011311
7 | FINANCIAL STATEMENTSAnalysis <strong>of</strong> Total Expenses <strong>of</strong> the Statement<strong>of</strong> Financial Performancefor the year ended 31st December, <strong>2010</strong>Actual (Rs. Mn.)<strong>2010</strong> 2009By FunctionalRecurrent % Capital % Total % Recurrent % Capital % Total %ClassificationDefence 197,758 20.78 16,314 2.04 214,072 12.23 182,972 20.75 30,357 3.51 213,329 12.21Law Enforcement 6,539 0.69 2,140 0.27 8,679 0.50 5,936 0.67 1,474 0.17 7,410 0.42Public Services 576,503 60.59 502,016 62.78 1,078,519 61.59 516,243 58.54 544,096 62.89 1,060,339 60.70Social Services 2,330 0.24 1,929 0.24 4,259 0.24 5,224 0.59 2,312 0.27 7,536 0.43Research <strong>and</strong> Technology 909 0.10 977 0.12 1,886 0.11 818 0.09 739 0.09 1,557 0.09Human Resources 88,110 9.26 24,666 3.08 112,776 6.44 81,168 9.20 21,243 2.46 102,411 5.86Infrastructure 21,525 2.26 180,834 22.62 202,359 11.56 34,186 3.88 187,540 21.68 221,726 12.69Environment 1,799 0.19 1,623 0.20 3,422 0.20 1,460 0.17 2,215 0.26 3,675 0.21Real Economy 56,021 5.89 69,120 8.64 125,141 7.15 53,929 6.11 75,152 8.69 129,081 7.39Total 951,494 100 799,619 100 1,751,113 100 881,936 100 865,128 100 1,747,064 100Note:These figures are presented inthe expenditure estimate for lineministries are based on resourceceiling available for each sectorunder which <strong>Ministry</strong> votes arepresented.312
- Page 4 and 5:
Ministry ofFinance and Planning(as
- Page 6 and 7:
Heads ofDepartments under thePurvie
- Page 8 and 9:
ContentsChapter 1 Development Persp
- Page 10 and 11:
Chapter 5 Foreign Financing 243Over
- Page 12:
Ministry of Finance and Planning Sr
- Page 15 and 16:
SRI LANKA AT A GLANCE - 2005 & 2010
- Page 17 and 18:
BRIEFINGSBriefings“Much remains t
- Page 20:
Ministry of Finance and Planning Sr
- Page 23:
1 | DEVELOPMENT PERSPECTIVESEconomi
- Page 27 and 28:
1 | DEVELOPMENT PERSPECTIVESThe Ser
- Page 29 and 30:
1 | DEVELOPMENT PERSPECTIVESMeanwhi
- Page 31 and 32:
1 | DEVELOPMENT PERSPECTIVESBox 1.1
- Page 33 and 34:
1 | DEVELOPMENT PERSPECTIVESDecline
- Page 35 and 36:
1 | DEVELOPMENT PERSPECTIVESThe inc
- Page 37 and 38:
1 | DEVELOPMENT PERSPECTIVESSince 1
- Page 39 and 40:
1 | DEVELOPMENT PERSPECTIVESBox 1.2
- Page 42 and 43:
Ministry of Finance and Planning Sr
- Page 44 and 45:
Ministry of Finance and Planning Sr
- Page 46 and 47:
Ministry of Finance and Planning Sr
- Page 48:
Ministry of Finance and Planning Sr
- Page 51 and 52:
1 | DEVELOPMENT PERSPECTIVESBox 1.5
- Page 53 and 54:
1 | DEVELOPMENT PERSPECTIVESThe inc
- Page 55 and 56:
1 | DEVELOPMENT PERSPECTIVESDevelop
- Page 57 and 58:
1 | DEVELOPMENT PERSPECTIVESChart 1
- Page 59 and 60:
1 | DEVELOPMENT PERSPECTIVESContd..
- Page 61 and 62:
1 | DEVELOPMENT PERSPECTIVESAviatio
- Page 63 and 64:
1 | DEVELOPMENT PERSPECTIVESTable 1
- Page 65 and 66:
1 | DEVELOPMENT PERSPECTIVESWater S
- Page 67 and 68:
1 | DEVELOPMENT PERSPECTIVESIn orde
- Page 69 and 70:
1 | DEVELOPMENT PERSPECTIVEStender
- Page 71 and 72:
1 | DEVELOPMENT PERSPECTIVESThe gov
- Page 73 and 74:
1 | DEVELOPMENT PERSPECTIVES• Nor
- Page 75 and 76:
1 | DEVELOPMENT PERSPECTIVESPropose
- Page 77 and 78:
1 | DEVELOPMENT PERSPECTIVESContd..
- Page 79 and 80:
1 | DEVELOPMENT PERSPECTIVESHealth
- Page 81 and 82:
1 | DEVELOPMENT PERSPECTIVESTable 1
- Page 83 and 84:
1 | DEVELOPMENT PERSPECTIVESHospita
- Page 85 and 86:
1 | DEVELOPMENT PERSPECTIVESThe pro
- Page 87 and 88:
1 | DEVELOPMENT PERSPECTIVESBox 1.8
- Page 89 and 90:
1 | DEVELOPMENT PERSPECTIVESNo.Tabl
- Page 91 and 92:
1 | DEVELOPMENT PERSPECTIVESChart:
- Page 93 and 94:
1 | DEVELOPMENT PERSPECTIVESNumber
- Page 95 and 96:
1 | DEVELOPMENT PERSPECTIVESEnviron
- Page 97 and 98:
1 | DEVELOPMENT PERSPECTIVESan incr
- Page 99 and 100:
1 | DEVELOPMENT PERSPECTIVESBox 1.9
- Page 101 and 102:
1 | DEVELOPMENT PERSPECTIVESTable 1
- Page 103 and 104:
1 | DEVELOPMENT PERSPECTIVESTable 1
- Page 105 and 106:
1 | DEVELOPMENT PERSPECTIVESIndustr
- Page 107 and 108:
1 | DEVELOPMENT PERSPECTIVESIn addi
- Page 109 and 110:
1 | DEVELOPMENT PERSPECTIVESTable 1
- Page 111 and 112:
1 | DEVELOPMENT PERSPECTIVESelectri
- Page 113 and 114:
1 | DEVELOPMENT PERSPECTIVESWelfare
- Page 115 and 116:
1 | DEVELOPMENT PERSPECTIVESEnhance
- Page 117 and 118:
1 | DEVELOPMENT PERSPECTIVESEnding
- Page 119:
1 | DEVELOPMENT PERSPECTIVESBox 1.1
- Page 122 and 123:
Ministry of Finance and Planning Sr
- Page 124 and 125:
Ministry of Finance and Planning Sr
- Page 126 and 127:
Ministry of Finance and Planning Sr
- Page 128 and 129:
Ministry of Finance and Planning Sr
- Page 130 and 131:
Ministry of Finance and Planning Sr
- Page 132 and 133:
Ministry of Finance and Planning Sr
- Page 134 and 135:
Ministry of Finance and Planning Sr
- Page 136 and 137:
Ministry of Finance and Planning Sr
- Page 138 and 139:
Ministry of Finance and Planning Sr
- Page 140:
Ministry of Finance and Planning Sr
- Page 143 and 144:
1 | DEVELOPMENT PERSPECTIVESWagesIn
- Page 146 and 147:
Ministry of Finance and Planning Sr
- Page 148 and 149:
Ministry of Finance and Planning Sr
- Page 150 and 151:
Ministry of Finance and Planning Sr
- Page 152 and 153:
Ministry of Finance and Planning Sr
- Page 154 and 155:
Ministry of Finance and Planning Sr
- Page 156 and 157:
Ministry of Finance and Planning Sr
- Page 158 and 159:
Ministry of Finance and Planning Sr
- Page 160 and 161:
Ministry of Finance and Planning Sr
- Page 162 and 163:
Ministry of Finance and Planning Sr
- Page 164 and 165:
Ministry of Finance and Planning Sr
- Page 166 and 167:
Ministry of Finance and Planning Sr
- Page 168 and 169:
Ministry of Finance and Planning Sr
- Page 170 and 171:
Ministry of Finance and Planning Sr
- Page 172 and 173:
Ministry of Finance and Planning Sr
- Page 174 and 175:
03REFORM INITIATIVES173
- Page 176 and 177:
Ministry of Finance and Planning Sr
- Page 178 and 179:
Ministry of Finance and Planning Sr
- Page 180 and 181:
Ministry of Finance and Planning Sr
- Page 182 and 183:
Ministry of Finance and Planning Sr
- Page 184 and 185:
Ministry of Finance and Planning Sr
- Page 186 and 187:
Ministry of Finance and Planning Sr
- Page 188 and 189:
Ministry of Finance and Planning Sr
- Page 190 and 191:
Ministry of Finance and Planning Sr
- Page 192 and 193:
Ministry of Finance and Planning Sr
- Page 194 and 195:
Ministry of Finance and Planning Sr
- Page 196 and 197:
Ministry of Finance and Planning Sr
- Page 198 and 199:
Ministry of Finance and Planning Sr
- Page 200:
Ministry of Finance and Planning Sr
- Page 203 and 204:
4 | State Owned Enterprises (SOE)Ov
- Page 205 and 206:
4 | State Owned Enterprises (SOE)Ta
- Page 207 and 208:
4 | State Owned Enterprises (SOE)Ta
- Page 209 and 210:
4 | State Owned Enterprises (SOE)Ba
- Page 211:
4 | State Owned Enterprises (SOE)Na
- Page 214 and 215:
Ministry of Finance and Planning Sr
- Page 216 and 217:
Ministry of Finance and Planning Sr
- Page 218 and 219:
Ministry of Finance and Planning Sr
- Page 220 and 221:
Ministry of Finance and Planning Sr
- Page 222 and 223:
Ministry of Finance and Planning Sr
- Page 224 and 225:
Ministry of Finance and Planning Sr
- Page 226 and 227:
Ministry of Finance and Planning Sr
- Page 228 and 229:
Ministry of Finance and Planning Sr
- Page 230 and 231:
Ministry of Finance and Planning Sr
- Page 232 and 233:
Ministry of Finance and Planning Sr
- Page 234 and 235:
Ministry of Finance and Planning Sr
- Page 236 and 237:
Ministry of Finance and Planning Sr
- Page 238 and 239:
Ministry of Finance and Planning Sr
- Page 240 and 241:
Ministry of Finance and Planning Sr
- Page 242 and 243:
Ministry of Finance and Planning Sr
- Page 244 and 245:
Ministry of Finance and Planning Sr
- Page 246 and 247:
Ministry of Finance and Planning Sr
- Page 248 and 249:
Ministry of Finance and Planning Sr
- Page 250 and 251:
Ministry of Finance and Planning Sr
- Page 252 and 253:
Ministry of Finance and Planning Sr
- Page 254 and 255:
Ministry of Finance and Planning Sr
- Page 256 and 257:
Ministry of Finance and Planning Sr
- Page 258 and 259:
Ministry of Finance and Planning Sr
- Page 260 and 261:
Ministry of Finance and Planning Sr
- Page 262 and 263: Ministry of Finance and Planning Sr
- Page 264 and 265: Ministry of Finance and Planning Sr
- Page 266 and 267: Ministry of Finance and Planning Sr
- Page 268 and 269: Ministry of Finance and Planning Sr
- Page 270 and 271: Ministry of Finance and Planning Sr
- Page 272 and 273: Ministry of Finance and Planning Sr
- Page 274 and 275: Ministry of Finance and Planning Sr
- Page 276 and 277: Ministry of Finance and Planning Sr
- Page 278 and 279: Ministry of Finance and Planning Sr
- Page 280 and 281: Ministry of Finance and Planning Sr
- Page 282 and 283: Ministry of Finance and Planning Sr
- Page 284 and 285: Ministry of Finance and Planning Sr
- Page 286 and 287: Ministry of Finance and Planning Sr
- Page 288: Ministry of Finance and Planning Sr
- Page 291 and 292: 6 | DEVELOPMENT FINANCEOverviewThe
- Page 293 and 294: 6 | DEVELOPMENT FINANCEduring the y
- Page 295 and 296: 6 | DEVELOPMENT FINANCEMicrofinance
- Page 297 and 298: 6 | DEVELOPMENT FINANCEBox 6.2Micro
- Page 299 and 300: 6 | DEVELOPMENT FINANCEfertilizer i
- Page 301 and 302: 6 | DEVELOPMENT FINANCETeaTea is th
- Page 303 and 304: 6 | DEVELOPMENT FINANCEIn order to
- Page 305 and 306: 6 | DEVELOPMENT FINANCETable 6.12 >
- Page 307 and 308: 6 | DEVELOPMENT FINANCEMap 6.1 > Pr
- Page 309 and 310: 7 | FINANCIAL STATEMENTSFinancial S
- Page 311: 7 | FINANCIAL STATEMENTSStatement o
- Page 315 and 316: 7 | FINANCIAL STATEMENTSStatement o
- Page 317 and 318: 7 | FINANCIAL STATEMENTSNotes to Fi
- Page 319 and 320: 7 | FINANCIAL STATEMENTSNotes to Fi
- Page 321 and 322: 7 | FINANCIAL STATEMENTSNotes to Fi
- Page 323 and 324: 7 | FINANCIAL STATEMENTSNotes to Fi
- Page 325 and 326: 7 | FINANCIAL STATEMENTSNotes to Fi
- Page 327 and 328: 7 | FINANCIAL STATEMENTSNotes to Fi
- Page 329 and 330: 7 | FINANCIAL STATEMENTSNotes to Fi
- Page 331 and 332: 7 | FINANCIAL STATEMENTSNotes to Fi
- Page 333 and 334: 7 | FINANCIAL STATEMENTSNotes to Fi
- Page 335 and 336: 7 | FINANCIAL STATEMENTSNotes to Fi
- Page 337 and 338: 7 | FINANCIAL STATEMENTSNotes to Fi
- Page 339 and 340: 7 | FINANCIAL STATEMENTSNotes to Fi
- Page 341 and 342: 7 | FINANCIAL STATEMENTSNotes to Fi
- Page 343 and 344: 7 | FINANCIAL STATEMENTSNotes to Fi
- Page 345 and 346: 7 | FINANCIAL STATEMENTSNotes to Fi
- Page 347 and 348: 7 | FINANCIAL STATEMENTSNotes to Fi
- Page 349 and 350: 7 | FINANCIAL STATEMENTSNotes to Fi
- Page 351 and 352: 7 | FINANCIAL STATEMENTSNotes to Fi
- Page 353 and 354: 7 | FINANCIAL STATEMENTSNotes to Fi
- Page 355 and 356: 7 | FINANCIAL STATEMENTSNotes to Fi
- Page 357 and 358: 7 | FINANCIAL STATEMENTSNotes to Fi
- Page 359 and 360: 7 | FINANCIAL STATEMENTSNotes to Fi
- Page 361 and 362: 7 | FINANCIAL STATEMENTSNotes to Fi
- Page 363 and 364:
7 | FINANCIAL STATEMENTSNotes to Fi
- Page 365 and 366:
7 | FINANCIAL STATEMENTSNotes to Fi
- Page 367 and 368:
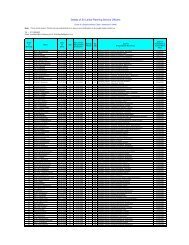
Financial StatementsHead-wise Summa
- Page 369 and 370:
Financial StatementsHead-wise Summa
- Page 371 and 372:
Financial statementsHead-wise Summa