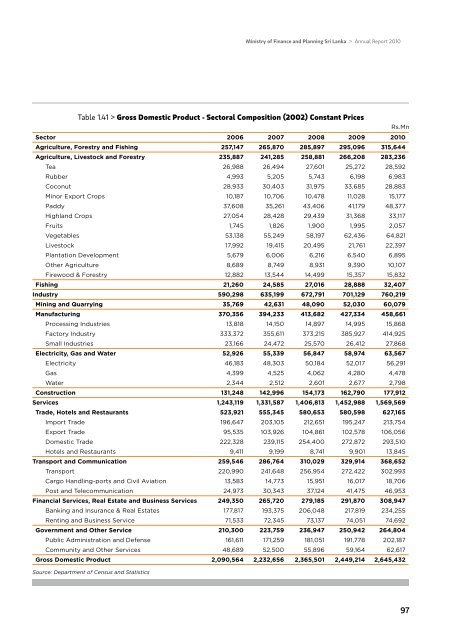
<strong>Ministry</strong> <strong>of</strong> <strong>Finance</strong> <strong>and</strong> <strong>Planning</strong> Sri Lanka > <strong>Annual</strong> <strong>Report</strong> <strong>2010</strong>Table 1.41 > Gross Domestic Product - Sectoral Composition (2002) Constant PricesRs.MnSector 2006 2007 2008 2009 <strong>2010</strong>Agriculture, Forestry <strong>and</strong> Fishing 257,147 265,870 285,897 295,096 315,644Agriculture, Livestock <strong>and</strong> Forestry 235,887 241,285 258,881 266,208 283,236Tea 26,988 26,494 27,601 25,272 28,592Rubber 4,993 5,205 5,743 6,198 6,983Coconut 28,933 30,403 31,975 33,685 28,883Minor Export Crops 10,187 10,706 10,478 11,028 15,177Paddy 37,608 35,261 43,406 41,179 48,377Highl<strong>and</strong> Crops 27,054 28,428 29,439 31,368 33,117Fruits 1,745 1,826 1,900 1,995 2,057Vegetables 53,138 55,249 58,197 62,436 64,821Livestock 17,992 19,415 20,495 21,761 22,397Plantation Development 5,679 6,006 6,216 6,540 6,895Other Agriculture 8,689 8,749 8,931 9,390 10,107Firewood & Forestry 12,882 13,544 14,499 15,357 15,832Fishing 21,260 24,585 27,016 28,888 32,407Industry 590,298 635,199 672,791 701,129 760,219Mining <strong>and</strong> Quarrying 35,769 42,631 48,090 52,030 60,079Manufacturing 370,356 394,233 413,682 427,334 458,661Processing Industries 13,818 14,150 14,897 14,995 15,868Factory Industry 333,372 355,611 373,215 385,927 414,925Small Industries 23,166 24,472 25,570 26,412 27,868Electricity, Gas <strong>and</strong> Water 52,926 55,339 56,847 58,974 63,567Electricity 46,183 48,303 50,184 52,017 56,291Gas 4,399 4,525 4,062 4,280 4,478Water 2,344 2,512 2,601 2,677 2,798Construction 131,248 142,996 154,173 162,790 177,912Services 1,243,119 1,331,587 1,406,813 1,452,988 1,569,569Trade, Hotels <strong>and</strong> Restaurants 523,921 555,345 580,653 580,598 627,165Import Trade 196,647 203,105 212,651 195,247 213,754Export Trade 95,535 103,926 104,861 102,578 106,056Domestic Trade 222,328 239,115 254,400 272,872 293,510Hotels <strong>and</strong> Restaurants 9,411 9,199 8,741 9,901 13,845Transport <strong>and</strong> Communication 259,546 286,764 310,029 329,914 368,652Transport 220,990 241,648 256,954 272,422 302,993Cargo H<strong>and</strong>ling-ports <strong>and</strong> Civil Aviation 13,583 14,773 15,951 16,017 18,706Post <strong>and</strong> Telecommunication 24,973 30,343 37,124 41,475 46,953Financial Services, Real Estate <strong>and</strong> Business Services 249,350 265,720 279,185 291,870 308,947Banking <strong>and</strong> Insurance & Real Estates 177,817 193,375 206,048 217,819 234,255Renting <strong>and</strong> Business Service 71,533 72,345 73,137 74,051 74,692Government <strong>and</strong> Other Service 210,300 223,759 236,947 250,942 264,804Public Administration <strong>and</strong> Defense 161,611 171,259 181,051 191,778 202,187Community <strong>and</strong> Other Services 48,689 52,500 55,896 59,164 62,617Gross Domestic Product 2,090,564 2,232,656 2,365,501 2,449,214 2,645,432Source: Department <strong>of</strong> Census <strong>and</strong> Statistics97
1 | DEVELOPMENT PERSPECTIVESBox 1.9Divi Neguma – An Initiative To Empower One Million Home Garden EconomiesThe government, recognizing the vulnerability <strong>of</strong> SriLankan households to an impending global food insecurity<strong>and</strong> environmental challenges, launched the establishment<strong>of</strong> one million domestic economic units under the “DiviNeguma” (Livelihood Upliftment) programme on 12March 2011 in line with the 2011 Budget proposal. The“Mahinda Chintana – The Vision for the Future”, alsohas emphasized the need to promote agriculture aimedat improving livelihood, rural development <strong>and</strong> foodsecurity. The objectives <strong>of</strong> the Divi Neguma programmeis to strengthen the people economically, minimizetheir dependence on the market for food requirements,improve the nutritional level <strong>of</strong> the families, <strong>and</strong> help thehouseholds be self-sufficient. The programme operatesunder the theme “A Self Reliant Household - A WonderfulMotherl<strong>and</strong>” <strong>and</strong> represents Sri Lanka’s own tradition <strong>of</strong>maintaining home gardens <strong>and</strong> producing daily needsfor being self-sufficient thereby serving as the basisfor a righteous society with the objective <strong>of</strong> ensuring aprosperous nation.The Divi Neguma programme will encourage eachhousehold to use their leisure hours <strong>and</strong> other resourcesto grow fruits, vegetables, flowers as well as maintainbackyard livestock at household level for their ownconsumption <strong>and</strong> to share the surplus with neighbours.It will also help people to add more fresh vegetables<strong>and</strong> fruits into their diet as well as to increase theconsumption <strong>of</strong> milk, eggs <strong>and</strong> other animal productsthereby improving nutritional level. The programme willalso help make new income sources to families by sellingexcess produce <strong>and</strong> create new entrepreneurs at villagelevel. The increased domestic agricultural productionwould lower the pressure on prices that arise due tosupply shortages.Overall, the government expects toassist the people to exp<strong>and</strong> their livelihoods <strong>and</strong> make anenhanced contribution to the national economy throughthis programme.Under the Divi Neguma programme, 100 households arebeing picked up from each <strong>of</strong> the 14,000 Grama Sevakadivisions in the country to enroll in this programme, atask that has been entrusted with government <strong>of</strong>ficialsworking at grass-root level; the Grama Niladhari, theSamurdhi Officer, the Agrarian Services Officer <strong>and</strong>Table 1.42 > Divi Neguma ProgrammeType <strong>of</strong> Plant Planned No. <strong>of</strong> Plants Estimated Average Acreage Estimated Output (MT)FruitsMango 1,000,000 25,000 125,000Papaya 1,000,000 3,000 15,000Banana 1,000,000 3,000 18,000VegetableTomatoes 5,000,000 500 3,000Brinjals 5,000,000 650 5,850Chili 3,000,000 275 275Coconut 2,000,000 31,000 77,500,000Source: <strong>Ministry</strong> <strong>of</strong> Economic Development98
- Page 4 and 5:
Ministry ofFinance and Planning(as
- Page 6 and 7:
Heads ofDepartments under thePurvie
- Page 8 and 9:
ContentsChapter 1 Development Persp
- Page 10 and 11:
Chapter 5 Foreign Financing 243Over
- Page 12:
Ministry of Finance and Planning Sr
- Page 15 and 16:
SRI LANKA AT A GLANCE - 2005 & 2010
- Page 17 and 18:
BRIEFINGSBriefings“Much remains t
- Page 20:
Ministry of Finance and Planning Sr
- Page 23:
1 | DEVELOPMENT PERSPECTIVESEconomi
- Page 27 and 28:
1 | DEVELOPMENT PERSPECTIVESThe Ser
- Page 29 and 30:
1 | DEVELOPMENT PERSPECTIVESMeanwhi
- Page 31 and 32:
1 | DEVELOPMENT PERSPECTIVESBox 1.1
- Page 33 and 34:
1 | DEVELOPMENT PERSPECTIVESDecline
- Page 35 and 36:
1 | DEVELOPMENT PERSPECTIVESThe inc
- Page 37 and 38:
1 | DEVELOPMENT PERSPECTIVESSince 1
- Page 39 and 40:
1 | DEVELOPMENT PERSPECTIVESBox 1.2
- Page 42 and 43:
Ministry of Finance and Planning Sr
- Page 44 and 45:
Ministry of Finance and Planning Sr
- Page 46 and 47:
Ministry of Finance and Planning Sr
- Page 48: Ministry of Finance and Planning Sr
- Page 51 and 52: 1 | DEVELOPMENT PERSPECTIVESBox 1.5
- Page 53 and 54: 1 | DEVELOPMENT PERSPECTIVESThe inc
- Page 55 and 56: 1 | DEVELOPMENT PERSPECTIVESDevelop
- Page 57 and 58: 1 | DEVELOPMENT PERSPECTIVESChart 1
- Page 59 and 60: 1 | DEVELOPMENT PERSPECTIVESContd..
- Page 61 and 62: 1 | DEVELOPMENT PERSPECTIVESAviatio
- Page 63 and 64: 1 | DEVELOPMENT PERSPECTIVESTable 1
- Page 65 and 66: 1 | DEVELOPMENT PERSPECTIVESWater S
- Page 67 and 68: 1 | DEVELOPMENT PERSPECTIVESIn orde
- Page 69 and 70: 1 | DEVELOPMENT PERSPECTIVEStender
- Page 71 and 72: 1 | DEVELOPMENT PERSPECTIVESThe gov
- Page 73 and 74: 1 | DEVELOPMENT PERSPECTIVES• Nor
- Page 75 and 76: 1 | DEVELOPMENT PERSPECTIVESPropose
- Page 77 and 78: 1 | DEVELOPMENT PERSPECTIVESContd..
- Page 79 and 80: 1 | DEVELOPMENT PERSPECTIVESHealth
- Page 81 and 82: 1 | DEVELOPMENT PERSPECTIVESTable 1
- Page 83 and 84: 1 | DEVELOPMENT PERSPECTIVESHospita
- Page 85 and 86: 1 | DEVELOPMENT PERSPECTIVESThe pro
- Page 87 and 88: 1 | DEVELOPMENT PERSPECTIVESBox 1.8
- Page 89 and 90: 1 | DEVELOPMENT PERSPECTIVESNo.Tabl
- Page 91 and 92: 1 | DEVELOPMENT PERSPECTIVESChart:
- Page 93 and 94: 1 | DEVELOPMENT PERSPECTIVESNumber
- Page 95 and 96: 1 | DEVELOPMENT PERSPECTIVESEnviron
- Page 97: 1 | DEVELOPMENT PERSPECTIVESan incr
- Page 101 and 102: 1 | DEVELOPMENT PERSPECTIVESTable 1
- Page 103 and 104: 1 | DEVELOPMENT PERSPECTIVESTable 1
- Page 105 and 106: 1 | DEVELOPMENT PERSPECTIVESIndustr
- Page 107 and 108: 1 | DEVELOPMENT PERSPECTIVESIn addi
- Page 109 and 110: 1 | DEVELOPMENT PERSPECTIVESTable 1
- Page 111 and 112: 1 | DEVELOPMENT PERSPECTIVESelectri
- Page 113 and 114: 1 | DEVELOPMENT PERSPECTIVESWelfare
- Page 115 and 116: 1 | DEVELOPMENT PERSPECTIVESEnhance
- Page 117 and 118: 1 | DEVELOPMENT PERSPECTIVESEnding
- Page 119: 1 | DEVELOPMENT PERSPECTIVESBox 1.1
- Page 122 and 123: Ministry of Finance and Planning Sr
- Page 124 and 125: Ministry of Finance and Planning Sr
- Page 126 and 127: Ministry of Finance and Planning Sr
- Page 128 and 129: Ministry of Finance and Planning Sr
- Page 130 and 131: Ministry of Finance and Planning Sr
- Page 132 and 133: Ministry of Finance and Planning Sr
- Page 134 and 135: Ministry of Finance and Planning Sr
- Page 136 and 137: Ministry of Finance and Planning Sr
- Page 138 and 139: Ministry of Finance and Planning Sr
- Page 140: Ministry of Finance and Planning Sr
- Page 143 and 144: 1 | DEVELOPMENT PERSPECTIVESWagesIn
- Page 146 and 147: Ministry of Finance and Planning Sr
- Page 148 and 149:
Ministry of Finance and Planning Sr
- Page 150 and 151:
Ministry of Finance and Planning Sr
- Page 152 and 153:
Ministry of Finance and Planning Sr
- Page 154 and 155:
Ministry of Finance and Planning Sr
- Page 156 and 157:
Ministry of Finance and Planning Sr
- Page 158 and 159:
Ministry of Finance and Planning Sr
- Page 160 and 161:
Ministry of Finance and Planning Sr
- Page 162 and 163:
Ministry of Finance and Planning Sr
- Page 164 and 165:
Ministry of Finance and Planning Sr
- Page 166 and 167:
Ministry of Finance and Planning Sr
- Page 168 and 169:
Ministry of Finance and Planning Sr
- Page 170 and 171:
Ministry of Finance and Planning Sr
- Page 172 and 173:
Ministry of Finance and Planning Sr
- Page 174 and 175:
03REFORM INITIATIVES173
- Page 176 and 177:
Ministry of Finance and Planning Sr
- Page 178 and 179:
Ministry of Finance and Planning Sr
- Page 180 and 181:
Ministry of Finance and Planning Sr
- Page 182 and 183:
Ministry of Finance and Planning Sr
- Page 184 and 185:
Ministry of Finance and Planning Sr
- Page 186 and 187:
Ministry of Finance and Planning Sr
- Page 188 and 189:
Ministry of Finance and Planning Sr
- Page 190 and 191:
Ministry of Finance and Planning Sr
- Page 192 and 193:
Ministry of Finance and Planning Sr
- Page 194 and 195:
Ministry of Finance and Planning Sr
- Page 196 and 197:
Ministry of Finance and Planning Sr
- Page 198 and 199:
Ministry of Finance and Planning Sr
- Page 200:
Ministry of Finance and Planning Sr
- Page 203 and 204:
4 | State Owned Enterprises (SOE)Ov
- Page 205 and 206:
4 | State Owned Enterprises (SOE)Ta
- Page 207 and 208:
4 | State Owned Enterprises (SOE)Ta
- Page 209 and 210:
4 | State Owned Enterprises (SOE)Ba
- Page 211:
4 | State Owned Enterprises (SOE)Na
- Page 214 and 215:
Ministry of Finance and Planning Sr
- Page 216 and 217:
Ministry of Finance and Planning Sr
- Page 218 and 219:
Ministry of Finance and Planning Sr
- Page 220 and 221:
Ministry of Finance and Planning Sr
- Page 222 and 223:
Ministry of Finance and Planning Sr
- Page 224 and 225:
Ministry of Finance and Planning Sr
- Page 226 and 227:
Ministry of Finance and Planning Sr
- Page 228 and 229:
Ministry of Finance and Planning Sr
- Page 230 and 231:
Ministry of Finance and Planning Sr
- Page 232 and 233:
Ministry of Finance and Planning Sr
- Page 234 and 235:
Ministry of Finance and Planning Sr
- Page 236 and 237:
Ministry of Finance and Planning Sr
- Page 238 and 239:
Ministry of Finance and Planning Sr
- Page 240 and 241:
Ministry of Finance and Planning Sr
- Page 242 and 243:
Ministry of Finance and Planning Sr
- Page 244 and 245:
Ministry of Finance and Planning Sr
- Page 246 and 247:
Ministry of Finance and Planning Sr
- Page 248 and 249:
Ministry of Finance and Planning Sr
- Page 250 and 251:
Ministry of Finance and Planning Sr
- Page 252 and 253:
Ministry of Finance and Planning Sr
- Page 254 and 255:
Ministry of Finance and Planning Sr
- Page 256 and 257:
Ministry of Finance and Planning Sr
- Page 258 and 259:
Ministry of Finance and Planning Sr
- Page 260 and 261:
Ministry of Finance and Planning Sr
- Page 262 and 263:
Ministry of Finance and Planning Sr
- Page 264 and 265:
Ministry of Finance and Planning Sr
- Page 266 and 267:
Ministry of Finance and Planning Sr
- Page 268 and 269:
Ministry of Finance and Planning Sr
- Page 270 and 271:
Ministry of Finance and Planning Sr
- Page 272 and 273:
Ministry of Finance and Planning Sr
- Page 274 and 275:
Ministry of Finance and Planning Sr
- Page 276 and 277:
Ministry of Finance and Planning Sr
- Page 278 and 279:
Ministry of Finance and Planning Sr
- Page 280 and 281:
Ministry of Finance and Planning Sr
- Page 282 and 283:
Ministry of Finance and Planning Sr
- Page 284 and 285:
Ministry of Finance and Planning Sr
- Page 286 and 287:
Ministry of Finance and Planning Sr
- Page 288:
Ministry of Finance and Planning Sr
- Page 291 and 292:
6 | DEVELOPMENT FINANCEOverviewThe
- Page 293 and 294:
6 | DEVELOPMENT FINANCEduring the y
- Page 295 and 296:
6 | DEVELOPMENT FINANCEMicrofinance
- Page 297 and 298:
6 | DEVELOPMENT FINANCEBox 6.2Micro
- Page 299 and 300:
6 | DEVELOPMENT FINANCEfertilizer i
- Page 301 and 302:
6 | DEVELOPMENT FINANCETeaTea is th
- Page 303 and 304:
6 | DEVELOPMENT FINANCEIn order to
- Page 305 and 306:
6 | DEVELOPMENT FINANCETable 6.12 >
- Page 307 and 308:
6 | DEVELOPMENT FINANCEMap 6.1 > Pr
- Page 309 and 310:
7 | FINANCIAL STATEMENTSFinancial S
- Page 311 and 312:
7 | FINANCIAL STATEMENTSStatement o
- Page 313 and 314:
7 | FINANCIAL STATEMENTSAnalysis of
- Page 315 and 316:
7 | FINANCIAL STATEMENTSStatement o
- Page 317 and 318:
7 | FINANCIAL STATEMENTSNotes to Fi
- Page 319 and 320:
7 | FINANCIAL STATEMENTSNotes to Fi
- Page 321 and 322:
7 | FINANCIAL STATEMENTSNotes to Fi
- Page 323 and 324:
7 | FINANCIAL STATEMENTSNotes to Fi
- Page 325 and 326:
7 | FINANCIAL STATEMENTSNotes to Fi
- Page 327 and 328:
7 | FINANCIAL STATEMENTSNotes to Fi
- Page 329 and 330:
7 | FINANCIAL STATEMENTSNotes to Fi
- Page 331 and 332:
7 | FINANCIAL STATEMENTSNotes to Fi
- Page 333 and 334:
7 | FINANCIAL STATEMENTSNotes to Fi
- Page 335 and 336:
7 | FINANCIAL STATEMENTSNotes to Fi
- Page 337 and 338:
7 | FINANCIAL STATEMENTSNotes to Fi
- Page 339 and 340:
7 | FINANCIAL STATEMENTSNotes to Fi
- Page 341 and 342:
7 | FINANCIAL STATEMENTSNotes to Fi
- Page 343 and 344:
7 | FINANCIAL STATEMENTSNotes to Fi
- Page 345 and 346:
7 | FINANCIAL STATEMENTSNotes to Fi
- Page 347 and 348:
7 | FINANCIAL STATEMENTSNotes to Fi
- Page 349 and 350:
7 | FINANCIAL STATEMENTSNotes to Fi
- Page 351 and 352:
7 | FINANCIAL STATEMENTSNotes to Fi
- Page 353 and 354:
7 | FINANCIAL STATEMENTSNotes to Fi
- Page 355 and 356:
7 | FINANCIAL STATEMENTSNotes to Fi
- Page 357 and 358:
7 | FINANCIAL STATEMENTSNotes to Fi
- Page 359 and 360:
7 | FINANCIAL STATEMENTSNotes to Fi
- Page 361 and 362:
7 | FINANCIAL STATEMENTSNotes to Fi
- Page 363 and 364:
7 | FINANCIAL STATEMENTSNotes to Fi
- Page 365 and 366:
7 | FINANCIAL STATEMENTSNotes to Fi
- Page 367 and 368:
Financial StatementsHead-wise Summa
- Page 369 and 370:
Financial StatementsHead-wise Summa
- Page 371 and 372:
Financial statementsHead-wise Summa