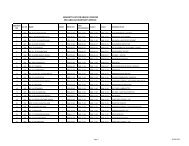
<strong>Ministry</strong> <strong>of</strong> <strong>Finance</strong> <strong>and</strong> <strong>Planning</strong> Sri Lanka > <strong>Annual</strong> <strong>Report</strong> <strong>2010</strong>Head-wise Summary <strong>of</strong> Expenditure Account withBudgetary Provision - <strong>2010</strong> contd...HeadNo.<strong>Ministry</strong>/Department TotalExpenditure(Rs.)TotalProvisions(Rs.)% RecurrentExpenditureRs.)RecurrentProvisions(Rs.)CapitalExpenditure(Rs.)CapitalProvisions(Rs.)253 Department <strong>of</strong> Pensions 102,731,726,161 102,753,450,000 100% 102,712,185,535 102,725,100,000 19,540,626 28,350,000254 Department <strong>of</strong> Registrar General 560,208,372 585,275,000 96% 509,680,295 519,275,000 50,528,077 66,000,000255 District Secretariat, Colombo 514,425,594 528,575,000 97% 389,543,836 401,075,000 124,881,759 127,500,000256 District Secretariat, Gampaha 550,639,958 561,925,000 98% 522,884,658 532,325,000 27,755,301 29,600,000257 District Secretariat, Kalutara 483,636,373 499,150,000 97% 432,214,158 447,400,000 51,422,214 51,750,000258 District Secretariat, K<strong>and</strong>y 632,507,572 656,325,000 96% 573,487,669 596,775,000 59,019,903 59,550,000259 District Secretariat, Matale 315,129,610 337,000,000 94% 295,546,816 306,500,000 19,582,794 30,500,000260 District Secretariat, Nuwara Eliya 309,296,662 363,100,000 85% 234,558,251 243,450,000 74,738,412 119,650,000261 District Secretariat, Galle 586,125,797 595,750,000 98% 538,612,933 548,050,000 47,512,865 47,700,000262 District Secretariat, Matara 510,635,173 528,050,000 97% 423,462,307 440,060,000 87,172,865 87,990,000263 District Secretariat, Hambantota 370,748,734 381,150,000 97% 323,520,747 332,667,182 47,227,987 48,482,818264 District Secretariat, Kchcheri - Jaffna 372,432,879 373,011,417 100% 302,407,537 302,925,000 70,025,342 70,086,417265 District Secretariat, Kchcheri - Mannar 122,501,750 125,439,000 98% 92,336,701 92,389,000 30,165,049 33,050,000266 District Secretariat, Kchcheri - Vavuniya 137,729,813 139,800,000 99% 94,891,705 96,750,000 42,838,108 43,050,000267 District Secretariat, Kchcheri - Mullaitive 95,848,813 99,395,000 96% 66,142,554 68,625,000 29,706,259 30,770,000268 District Secretariat, Kchcheri - Kilinochchi 122,152,436 125,925,519 97% 74,151,294 76,650,000 48,001,143 49,275,519269 District Secretariat, Kchcheri - Batticaloa 277,004,932 296,350,000 93% 254,852,319 260,200,000 22,152,613 36,150,000270 District Secretariat, Kchcheri - Ampara 503,922,311 523,525,000 96% 416,599,002 435,125,000 87,323,309 88,400,000271 District Secretariat, Kchcheri - Trincomalee 229,358,308 234,450,376 98% 177,042,775 180,666,376 52,315,533 53,784,000272 District Secretariat, Kurunegala 852,427,429 892,850,000 95% 801,862,689 839,450,000 50,564,740 53,400,000273 District Secretariat, Puttalam 393,321,780 466,700,000 84% 334,841,012 350,400,000 58,480,768 116,300,000274 District Secretariat, Anuradhapura 461,385,136 478,225,000 96% 421,735,267 437,075,000 39,649,869 41,150,000275 District Secretariat, Polonnaruwa 221,991,173 231,675,000 96% 189,486,599 198,725,000 32,504,574 32,950,000276 District Secretariat, Badulla 405,229,457 419,400,000 97% 335,769,235 345,250,000 69,460,222 74,150,000277 District Secretariat, Monaragala 338,298,613 342,550,000 99% 237,507,345 241,400,000 100,791,268 101,150,000278 District Secretariat, Ratnapura 401,480,004 412,900,000 97% 371,616,811 381,350,000 29,863,192 31,550,000279 District Secretariat, Kegalle 311,437,482 347,075,000 90% 296,518,794 311,075,000 14,918,687 36,000,000280 Department <strong>of</strong> Foreign Aid & Budget Monitoring 58,484,635 89,135,000 66% 51,472,755 58,375,000 7,011,880 30,760,000281 Department <strong>of</strong> Agrarian Development 2,935,646,041 3,038,900,000 97% 2,742,827,052 2,841,400,000 192,818,989 197,500,000282 Department <strong>of</strong> Irrigation 4,710,654,611 5,929,790,000 79% 1,126,493,498 1,206,590,000 3,584,161,113 4,723,200,000283 Department <strong>of</strong> Forest 1,001,854,548 1,025,600,000 98% 718,090,348 741,100,000 283,764,199 284,500,000284 Department <strong>of</strong> Wild Life Conservation 951,697,260 1,006,013,000 95% 433,268,017 453,063,000 518,429,242 552,950,000285 Department <strong>of</strong> Agriculture 2,112,734,184 2,312,922,000 91% 1,666,525,421 1,761,562,000 446,208,764 551,360,000286 Department <strong>of</strong> L<strong>and</strong> Commissioner 422,330,572 440,976,000 96% 154,349,237 171,725,000 267,981,335 269,251,000287 Department <strong>of</strong> L<strong>and</strong> Settlelment 162,852,468 173,505,000 94% 157,498,857 167,910,000 5,353,611 5,595,000288 Department <strong>of</strong> Surveyor General 1,635,831,177 1,722,068,000 95% 1,555,974,986 1,638,276,000 79,856,192 83,792,000289 Department <strong>of</strong> Export Agriculture 453,002,326 473,387,000 96% 237,607,130 248,087,000 215,395,196 225,300,000290 Department <strong>of</strong> Fisheries & Aquatic Resources 252,849,433 254,055,000 100% 215,838,776 216,330,000 37,010,657 37,725,000291 Department <strong>of</strong> Coast Conservation 316,673,041 332,780,000 95% 113,353,081 113,630,000 203,319,960 219,150,000292 Department <strong>of</strong> Animal Production & Health 555,666,810 706,716,000 79% 270,846,241 275,766,000 284,820,569 430,950,000293 Department <strong>of</strong> Rubber Development 583,970,569 658,020,000 89% 368,456,463 376,120,000 215,514,106 281,900,000369
Financial statementsHead-wise Summary <strong>of</strong> Expenditure Account withBudgetary Provision - <strong>2010</strong> contd...HeadNo.<strong>Ministry</strong>/Department TotalExpenditure(Rs.)TotalProvisions(Rs.)% RecurrentExpenditureRs.)RecurrentProvisions(Rs.)CapitalExpenditure(Rs.)CapitalProvisions(Rs.)294 Department <strong>of</strong> National Zoological Gardens 371,194,493 401,289,000 93% 133,305,870 133,939,000 237,888,623 267,350,000295 Department <strong>of</strong> Commerce 518,750,561 535,745,000 97% 74,393,296 86,920,000 444,357,265 448,825,000296 Department <strong>of</strong> Import & Export Control 34,089,682 35,858,000 95% 33,785,208 35,508,000 304,474 350,000297 Department <strong>of</strong> Registrar <strong>of</strong> Companies 21,553,583 22,950,000 94% 21,553,583 22,950,000 0 0298 Department <strong>of</strong> Measurement Unit St<strong>and</strong>ards & Services 85,680,495 111,692,000 77% 50,764,938 52,192,000 34,915,557 59,500,000299 National Intellectual Property Office <strong>of</strong> Sri Lanka 12,927,217 16,360,000 79% 12,927,217 16,360,000 0 0300 Department <strong>of</strong> Food Commissioner 92,963,192 108,196,000 86% 65,835,543 80,233,800 27,127,649 27,962,200301 Department <strong>of</strong> Co-operative Development 468,510,471 507,940,000 92% 42,472,157 44,290,000 426,038,313 463,650,000302 Co-operative Employees Commission 8,370,178 10,846,000 77% 8,155,438 10,520,000 214,740 326,000303 Department <strong>of</strong> Textile Industries 68,668,509 77,822,000 88% 49,860,371 55,389,000 18,808,138 22,433,000304 Department <strong>of</strong> Meteorology 193,310,555 270,320,000 72% 144,808,683 149,680,000 48,501,873 120,640,000305 Department <strong>of</strong> Up-country Peasantry Rehabilitation 13,190,406 17,145,000 77% 12,246,020 16,145,000 944,386 1,000,000306 Department <strong>of</strong> Sri Lanka Railways 19,355,534,795 27,036,350,000 72% 7,191,352,333 7,285,750,000 12,164,182,462 19,750,600,000307 Department <strong>of</strong> Motor Traffic 1,760,553,236 1,883,704,000 93% 716,620,372 773,154,000 1,043,932,864 1,110,550,000308 Department <strong>of</strong> Posts 7,538,615,445 7,605,600,000 99% 7,333,147,367 7,371,300,000 205,468,078 234,300,000309 Department <strong>of</strong> Buildings 204,711,527 211,892,000 97% 187,978,561 194,772,000 16,732,966 17,120,000310 Government Factory 71,829,362 74,535,000 96% 44,358,368 45,095,000 27,470,994 29,440,000311 Department <strong>of</strong> National Physical <strong>Planning</strong> 153,821,206 159,190,000 97% 133,797,006 136,140,000 20,024,199 23,050,000312 Western Provincial Council 8,219,188,977 8,305,600,000 99% 6,100,000,000 6,100,000,000 2,119,188,977 2,205,600,000313 Central Provincial Council 15,221,058,780 15,554,650,000 98% 13,000,000,000 13,000,000,000 2,221,058,780 2,554,650,000314 Southern Provincial Council, Galle 12,454,801,911 12,632,881,887 99% 10,500,000,000 10,500,000,000 1,954,801,911 2,132,881,887315 North East Provincial Council 11,323,814,780 11,981,170,000 95% 8,700,000,000 8,700,000,000 2,623,814,780 3,281,170,000316 North Western Provincial Council 14,167,370,136 14,232,800,000 100% 12,299,000,000 12,300,000,000 1,868,370,136 1,932,800,000317 North Central Provincial Council 10,681,444,683 10,830,350,000 99% 7,300,000,000 7,300,000,000 3,381,444,683 3,530,350,000318 Uva Provincial Council 10,993,312,692 11,540,090,000 95% 8,300,000,000 8,300,000,000 2,693,312,692 3,240,090,000319 Sabaragamuva Provincial Council 10,886,651,806 11,117,600,000 98% 9,000,000,000 9,000,000,000 1,886,651,806 2,117,600,000320 Department <strong>of</strong> Civil Security 8,708,279,328 8,710,450,000 100% 8,454,747,529 8,456,450,000 253,531,798 254,000,000321 Eastern Provincial Council 13,049,784,114 13,787,760,000 95% 10,100,000,000 10,100,000,000 2,949,784,114 3,687,760,000322 Department <strong>of</strong> National Botanical Gardens 298,620,048 304,768,000 98% 149,637,238 154,178,000 148,982,810 150,590,000323 Department <strong>of</strong> Legal Affairs 8,073,533 8,520,000 95% 7,519,134 7,870,000 554,399 650,000324 Department <strong>of</strong> Management Audit 14,321,424 14,360,000 100% 13,776,463 13,802,000 544,961 558,000325 Department <strong>of</strong> Coast Guard <strong>of</strong> Sri Lanka 48,234,893 60,175,000 80% 19,249,667 19,675,000 28,985,227 40,500,000326 Department <strong>of</strong> Community Base Correction 70,275,481 72,350,000 97% 53,852,266 54,400,000 16,423,215 17,950,000Total 1,751,112,476,010 1,831,654,767,200 96% 951,493,955,879 976,050,553,014 799,618,520,131 855,604,214,186370
- Page 4 and 5:
Ministry ofFinance and Planning(as
- Page 6 and 7:
Heads ofDepartments under thePurvie
- Page 8 and 9:
ContentsChapter 1 Development Persp
- Page 10 and 11:
Chapter 5 Foreign Financing 243Over
- Page 12:
Ministry of Finance and Planning Sr
- Page 15 and 16:
SRI LANKA AT A GLANCE - 2005 & 2010
- Page 17 and 18:
BRIEFINGSBriefings“Much remains t
- Page 20:
Ministry of Finance and Planning Sr
- Page 23:
1 | DEVELOPMENT PERSPECTIVESEconomi
- Page 27 and 28:
1 | DEVELOPMENT PERSPECTIVESThe Ser
- Page 29 and 30:
1 | DEVELOPMENT PERSPECTIVESMeanwhi
- Page 31 and 32:
1 | DEVELOPMENT PERSPECTIVESBox 1.1
- Page 33 and 34:
1 | DEVELOPMENT PERSPECTIVESDecline
- Page 35 and 36:
1 | DEVELOPMENT PERSPECTIVESThe inc
- Page 37 and 38:
1 | DEVELOPMENT PERSPECTIVESSince 1
- Page 39 and 40:
1 | DEVELOPMENT PERSPECTIVESBox 1.2
- Page 42 and 43:
Ministry of Finance and Planning Sr
- Page 44 and 45:
Ministry of Finance and Planning Sr
- Page 46 and 47:
Ministry of Finance and Planning Sr
- Page 48:
Ministry of Finance and Planning Sr
- Page 51 and 52:
1 | DEVELOPMENT PERSPECTIVESBox 1.5
- Page 53 and 54:
1 | DEVELOPMENT PERSPECTIVESThe inc
- Page 55 and 56:
1 | DEVELOPMENT PERSPECTIVESDevelop
- Page 57 and 58:
1 | DEVELOPMENT PERSPECTIVESChart 1
- Page 59 and 60:
1 | DEVELOPMENT PERSPECTIVESContd..
- Page 61 and 62:
1 | DEVELOPMENT PERSPECTIVESAviatio
- Page 63 and 64:
1 | DEVELOPMENT PERSPECTIVESTable 1
- Page 65 and 66:
1 | DEVELOPMENT PERSPECTIVESWater S
- Page 67 and 68:
1 | DEVELOPMENT PERSPECTIVESIn orde
- Page 69 and 70:
1 | DEVELOPMENT PERSPECTIVEStender
- Page 71 and 72:
1 | DEVELOPMENT PERSPECTIVESThe gov
- Page 73 and 74:
1 | DEVELOPMENT PERSPECTIVES• Nor
- Page 75 and 76:
1 | DEVELOPMENT PERSPECTIVESPropose
- Page 77 and 78:
1 | DEVELOPMENT PERSPECTIVESContd..
- Page 79 and 80:
1 | DEVELOPMENT PERSPECTIVESHealth
- Page 81 and 82:
1 | DEVELOPMENT PERSPECTIVESTable 1
- Page 83 and 84:
1 | DEVELOPMENT PERSPECTIVESHospita
- Page 85 and 86:
1 | DEVELOPMENT PERSPECTIVESThe pro
- Page 87 and 88:
1 | DEVELOPMENT PERSPECTIVESBox 1.8
- Page 89 and 90:
1 | DEVELOPMENT PERSPECTIVESNo.Tabl
- Page 91 and 92:
1 | DEVELOPMENT PERSPECTIVESChart:
- Page 93 and 94:
1 | DEVELOPMENT PERSPECTIVESNumber
- Page 95 and 96:
1 | DEVELOPMENT PERSPECTIVESEnviron
- Page 97 and 98:
1 | DEVELOPMENT PERSPECTIVESan incr
- Page 99 and 100:
1 | DEVELOPMENT PERSPECTIVESBox 1.9
- Page 101 and 102:
1 | DEVELOPMENT PERSPECTIVESTable 1
- Page 103 and 104:
1 | DEVELOPMENT PERSPECTIVESTable 1
- Page 105 and 106:
1 | DEVELOPMENT PERSPECTIVESIndustr
- Page 107 and 108:
1 | DEVELOPMENT PERSPECTIVESIn addi
- Page 109 and 110:
1 | DEVELOPMENT PERSPECTIVESTable 1
- Page 111 and 112:
1 | DEVELOPMENT PERSPECTIVESelectri
- Page 113 and 114:
1 | DEVELOPMENT PERSPECTIVESWelfare
- Page 115 and 116:
1 | DEVELOPMENT PERSPECTIVESEnhance
- Page 117 and 118:
1 | DEVELOPMENT PERSPECTIVESEnding
- Page 119:
1 | DEVELOPMENT PERSPECTIVESBox 1.1
- Page 122 and 123:
Ministry of Finance and Planning Sr
- Page 124 and 125:
Ministry of Finance and Planning Sr
- Page 126 and 127:
Ministry of Finance and Planning Sr
- Page 128 and 129:
Ministry of Finance and Planning Sr
- Page 130 and 131:
Ministry of Finance and Planning Sr
- Page 132 and 133:
Ministry of Finance and Planning Sr
- Page 134 and 135:
Ministry of Finance and Planning Sr
- Page 136 and 137:
Ministry of Finance and Planning Sr
- Page 138 and 139:
Ministry of Finance and Planning Sr
- Page 140:
Ministry of Finance and Planning Sr
- Page 143 and 144:
1 | DEVELOPMENT PERSPECTIVESWagesIn
- Page 146 and 147:
Ministry of Finance and Planning Sr
- Page 148 and 149:
Ministry of Finance and Planning Sr
- Page 150 and 151:
Ministry of Finance and Planning Sr
- Page 152 and 153:
Ministry of Finance and Planning Sr
- Page 154 and 155:
Ministry of Finance and Planning Sr
- Page 156 and 157:
Ministry of Finance and Planning Sr
- Page 158 and 159:
Ministry of Finance and Planning Sr
- Page 160 and 161:
Ministry of Finance and Planning Sr
- Page 162 and 163:
Ministry of Finance and Planning Sr
- Page 164 and 165:
Ministry of Finance and Planning Sr
- Page 166 and 167:
Ministry of Finance and Planning Sr
- Page 168 and 169:
Ministry of Finance and Planning Sr
- Page 170 and 171:
Ministry of Finance and Planning Sr
- Page 172 and 173:
Ministry of Finance and Planning Sr
- Page 174 and 175:
03REFORM INITIATIVES173
- Page 176 and 177:
Ministry of Finance and Planning Sr
- Page 178 and 179:
Ministry of Finance and Planning Sr
- Page 180 and 181:
Ministry of Finance and Planning Sr
- Page 182 and 183:
Ministry of Finance and Planning Sr
- Page 184 and 185:
Ministry of Finance and Planning Sr
- Page 186 and 187:
Ministry of Finance and Planning Sr
- Page 188 and 189:
Ministry of Finance and Planning Sr
- Page 190 and 191:
Ministry of Finance and Planning Sr
- Page 192 and 193:
Ministry of Finance and Planning Sr
- Page 194 and 195:
Ministry of Finance and Planning Sr
- Page 196 and 197:
Ministry of Finance and Planning Sr
- Page 198 and 199:
Ministry of Finance and Planning Sr
- Page 200:
Ministry of Finance and Planning Sr
- Page 203 and 204:
4 | State Owned Enterprises (SOE)Ov
- Page 205 and 206:
4 | State Owned Enterprises (SOE)Ta
- Page 207 and 208:
4 | State Owned Enterprises (SOE)Ta
- Page 209 and 210:
4 | State Owned Enterprises (SOE)Ba
- Page 211:
4 | State Owned Enterprises (SOE)Na
- Page 214 and 215:
Ministry of Finance and Planning Sr
- Page 216 and 217:
Ministry of Finance and Planning Sr
- Page 218 and 219:
Ministry of Finance and Planning Sr
- Page 220 and 221:
Ministry of Finance and Planning Sr
- Page 222 and 223:
Ministry of Finance and Planning Sr
- Page 224 and 225:
Ministry of Finance and Planning Sr
- Page 226 and 227:
Ministry of Finance and Planning Sr
- Page 228 and 229:
Ministry of Finance and Planning Sr
- Page 230 and 231:
Ministry of Finance and Planning Sr
- Page 232 and 233:
Ministry of Finance and Planning Sr
- Page 234 and 235:
Ministry of Finance and Planning Sr
- Page 236 and 237:
Ministry of Finance and Planning Sr
- Page 238 and 239:
Ministry of Finance and Planning Sr
- Page 240 and 241:
Ministry of Finance and Planning Sr
- Page 242 and 243:
Ministry of Finance and Planning Sr
- Page 244 and 245:
Ministry of Finance and Planning Sr
- Page 246 and 247:
Ministry of Finance and Planning Sr
- Page 248 and 249:
Ministry of Finance and Planning Sr
- Page 250 and 251:
Ministry of Finance and Planning Sr
- Page 252 and 253:
Ministry of Finance and Planning Sr
- Page 254 and 255:
Ministry of Finance and Planning Sr
- Page 256 and 257:
Ministry of Finance and Planning Sr
- Page 258 and 259:
Ministry of Finance and Planning Sr
- Page 260 and 261:
Ministry of Finance and Planning Sr
- Page 262 and 263:
Ministry of Finance and Planning Sr
- Page 264 and 265:
Ministry of Finance and Planning Sr
- Page 266 and 267:
Ministry of Finance and Planning Sr
- Page 268 and 269:
Ministry of Finance and Planning Sr
- Page 270 and 271:
Ministry of Finance and Planning Sr
- Page 272 and 273:
Ministry of Finance and Planning Sr
- Page 274 and 275:
Ministry of Finance and Planning Sr
- Page 276 and 277:
Ministry of Finance and Planning Sr
- Page 278 and 279:
Ministry of Finance and Planning Sr
- Page 280 and 281:
Ministry of Finance and Planning Sr
- Page 282 and 283:
Ministry of Finance and Planning Sr
- Page 284 and 285:
Ministry of Finance and Planning Sr
- Page 286 and 287:
Ministry of Finance and Planning Sr
- Page 288:
Ministry of Finance and Planning Sr
- Page 291 and 292:
6 | DEVELOPMENT FINANCEOverviewThe
- Page 293 and 294:
6 | DEVELOPMENT FINANCEduring the y
- Page 295 and 296:
6 | DEVELOPMENT FINANCEMicrofinance
- Page 297 and 298:
6 | DEVELOPMENT FINANCEBox 6.2Micro
- Page 299 and 300:
6 | DEVELOPMENT FINANCEfertilizer i
- Page 301 and 302:
6 | DEVELOPMENT FINANCETeaTea is th
- Page 303 and 304:
6 | DEVELOPMENT FINANCEIn order to
- Page 305 and 306:
6 | DEVELOPMENT FINANCETable 6.12 >
- Page 307 and 308:
6 | DEVELOPMENT FINANCEMap 6.1 > Pr
- Page 309 and 310:
7 | FINANCIAL STATEMENTSFinancial S
- Page 311 and 312:
7 | FINANCIAL STATEMENTSStatement o
- Page 313 and 314:
7 | FINANCIAL STATEMENTSAnalysis of
- Page 315 and 316:
7 | FINANCIAL STATEMENTSStatement o
- Page 317 and 318:
7 | FINANCIAL STATEMENTSNotes to Fi
- Page 319 and 320: 7 | FINANCIAL STATEMENTSNotes to Fi
- Page 321 and 322: 7 | FINANCIAL STATEMENTSNotes to Fi
- Page 323 and 324: 7 | FINANCIAL STATEMENTSNotes to Fi
- Page 325 and 326: 7 | FINANCIAL STATEMENTSNotes to Fi
- Page 327 and 328: 7 | FINANCIAL STATEMENTSNotes to Fi
- Page 329 and 330: 7 | FINANCIAL STATEMENTSNotes to Fi
- Page 331 and 332: 7 | FINANCIAL STATEMENTSNotes to Fi
- Page 333 and 334: 7 | FINANCIAL STATEMENTSNotes to Fi
- Page 335 and 336: 7 | FINANCIAL STATEMENTSNotes to Fi
- Page 337 and 338: 7 | FINANCIAL STATEMENTSNotes to Fi
- Page 339 and 340: 7 | FINANCIAL STATEMENTSNotes to Fi
- Page 341 and 342: 7 | FINANCIAL STATEMENTSNotes to Fi
- Page 343 and 344: 7 | FINANCIAL STATEMENTSNotes to Fi
- Page 345 and 346: 7 | FINANCIAL STATEMENTSNotes to Fi
- Page 347 and 348: 7 | FINANCIAL STATEMENTSNotes to Fi
- Page 349 and 350: 7 | FINANCIAL STATEMENTSNotes to Fi
- Page 351 and 352: 7 | FINANCIAL STATEMENTSNotes to Fi
- Page 353 and 354: 7 | FINANCIAL STATEMENTSNotes to Fi
- Page 355 and 356: 7 | FINANCIAL STATEMENTSNotes to Fi
- Page 357 and 358: 7 | FINANCIAL STATEMENTSNotes to Fi
- Page 359 and 360: 7 | FINANCIAL STATEMENTSNotes to Fi
- Page 361 and 362: 7 | FINANCIAL STATEMENTSNotes to Fi
- Page 363 and 364: 7 | FINANCIAL STATEMENTSNotes to Fi
- Page 365 and 366: 7 | FINANCIAL STATEMENTSNotes to Fi
- Page 367 and 368: Financial StatementsHead-wise Summa
- Page 369: Financial StatementsHead-wise Summa