Phase-field modeling of diffusion controlled phase ... - KTH Mechanics
Phase-field modeling of diffusion controlled phase ... - KTH Mechanics
Phase-field modeling of diffusion controlled phase ... - KTH Mechanics

You also want an ePaper? Increase the reach of your titles
YUMPU automatically turns print PDFs into web optimized ePapers that Google loves.
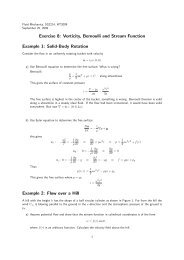
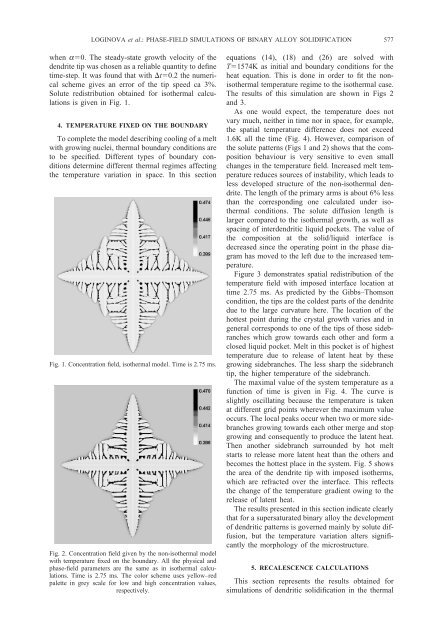
LOGINOVA et al.: PHASE-FIELD SIMULATIONS OF BINARY ALLOY SOLIDIFICATION577when a0. The steady-state growth velocity <strong>of</strong> thedendrite tip was chosen as a reliable quantity to definetime-step. It was found that with t0.2 the numericalscheme gives an error <strong>of</strong> the tip speed ca 3%.Solute redistribution obtained for isothermal calculationsis given in Fig. 1.4. TEMPERATURE FIXED ON THE BOUNDARYTo complete the model describing cooling <strong>of</strong> a meltwith growing nuclei, thermal boundary conditions areto be specified. Different types <strong>of</strong> boundary conditionsdetermine different thermal regimes affectingthe temperature variation in space. In this sectionFig. 1. Concentration <strong>field</strong>, isothermal model. Time is 2.75 ms.Fig. 2. Concentration <strong>field</strong> given by the non-isothermal modelwith temperature fixed on the boundary. All the physical and<strong>phase</strong>-<strong>field</strong> parameters are the same as in isothermal calculations.Time is 2.75 ms. The color scheme uses yellow–redpalette in grey scale for low and high concentration values,respectively.equations (14), (18) and (26) are solved withT1574K as initial and boundary conditions for theheat equation. This is done in order to fit the nonisothermaltemperature regime to the isothermal case.The results <strong>of</strong> this simulation are shown in Figs 2and 3.As one would expect, the temperature does notvary much, neither in time nor in space, for example,the spatial temperature difference does not exceed1.6K all the time (Fig. 4). However, comparison <strong>of</strong>the solute patterns (Figs 1 and 2) shows that the compositionbehaviour is very sensitive to even smallchanges in the temperature <strong>field</strong>. Increased melt temperaturereduces sources <strong>of</strong> instability, which leads toless developed structure <strong>of</strong> the non-isothermal dendrite.The length <strong>of</strong> the primary arms is about 6% lessthan the corresponding one calculated under isothermalconditions. The solute <strong>diffusion</strong> length islarger compared to the isothermal growth, as well asspacing <strong>of</strong> interdendritic liquid pockets. The value <strong>of</strong>the composition at the solid/liquid interface isdecreased since the operating point in the <strong>phase</strong> diagramhas moved to the left due to the increased temperature.Figure 3 demonstrates spatial redistribution <strong>of</strong> thetemperature <strong>field</strong> with imposed interface location attime 2.75 ms. As predicted by the Gibbs–Thomsoncondition, the tips are the coldest parts <strong>of</strong> the dendritedue to the large curvature here. The location <strong>of</strong> thehottest point during the crystal growth varies and ingeneral corresponds to one <strong>of</strong> the tips <strong>of</strong> those sidebrancheswhich grow towards each other and form aclosed liquid pocket. Melt in this pocket is <strong>of</strong> highesttemperature due to release <strong>of</strong> latent heat by thesegrowing sidebranches. The less sharp the sidebranchtip, the higher temperature <strong>of</strong> the sidebranch.The maximal value <strong>of</strong> the system temperature as afunction <strong>of</strong> time is given in Fig. 4. The curve isslightly oscillating because the temperature is takenat different grid points wherever the maximum valueoccurs. The local peaks occur when two or more sidebranchesgrowing towards each other merge and stopgrowing and consequently to produce the latent heat.Then another sidebranch surrounded by hot meltstarts to release more latent heat than the others andbecomes the hottest place in the system. Fig. 5 showsthe area <strong>of</strong> the dendrite tip with imposed isotherms,which are refracted over the interface. This reflectsthe change <strong>of</strong> the temperature gradient owing to therelease <strong>of</strong> latent heat.The results presented in this section indicate clearlythat for a supersaturated binary alloy the development<strong>of</strong> dendritic patterns is governed mainly by solute <strong>diffusion</strong>,but the temperature variation alters significantlythe morphology <strong>of</strong> the microstructure.5. RECALESCENCE CALCULATIONSThis section represents the results obtained forsimulations <strong>of</strong> dendritic solidification in the thermal