Phase-field modeling of diffusion controlled phase ... - KTH Mechanics
Phase-field modeling of diffusion controlled phase ... - KTH Mechanics
Phase-field modeling of diffusion controlled phase ... - KTH Mechanics

You also want an ePaper? Increase the reach of your titles
YUMPU automatically turns print PDFs into web optimized ePapers that Google loves.
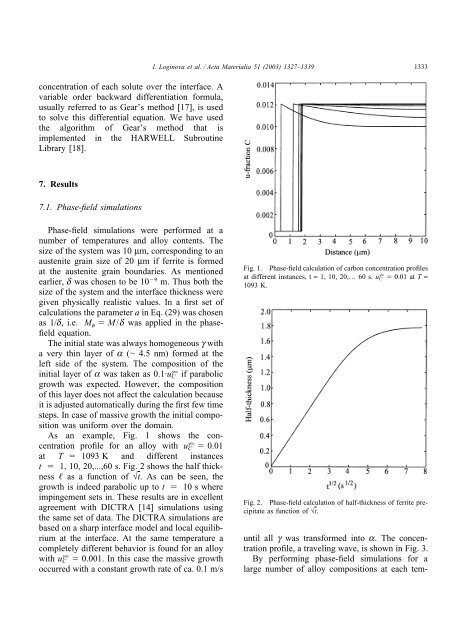
I. Loginova et al. / Acta Materialia 51 (2003) 1327–13391333concentration <strong>of</strong> each solute over the interface. Avariable order backward differentiation formula,usually referred to as Gear’s method [17], is usedto solve this differential equation. We have usedthe algorithm <strong>of</strong> Gear’s method that isimplemented in the HARWELL SubroutineLibrary [18].7. Results7.1. <strong>Phase</strong>-<strong>field</strong> simulations<strong>Phase</strong>-<strong>field</strong> simulations were performed at anumber <strong>of</strong> temperatures and alloy contents. Thesize <strong>of</strong> the system was 10 µm, corresponding to anaustenite grain size <strong>of</strong> 20 µm if ferrite is formedat the austenite grain boundaries. As mentionedearlier, d was chosen to be 10 9 m. Thus both thesize <strong>of</strong> the system and the interface thickness weregiven physically realistic values. In a first set <strong>of</strong>calculations the parameter a in Eq. (29) was chosenas 1/d, i.e. M f M/d was applied in the <strong>phase</strong><strong>field</strong>equation.The initial state was always homogeneous g witha very thin layer <strong>of</strong> a ( 4.5 nm) formed at theleft side <strong>of</strong> the system. The composition <strong>of</strong> theinitial layer <strong>of</strong> a was taken as 0.1·uCg if parabolicgrowth was expected. However, the composition<strong>of</strong> this layer does not affect the calculation becauseit is adjusted automatically during the first few timesteps. In case <strong>of</strong> massive growth the initial compositionwas uniform over the domain.As an example, Fig. 1 shows the concentrationpr<strong>of</strong>ile for an alloy with u gC 0.01at T 1093 K and different instancest 1, 10, 20,...,60 s. Fig. 2 shows the half thickness as a function <strong>of</strong> √t. As can be seen, thegrowth is indeed parabolic up to t 10 s whereimpingement sets in. These results are in excellentagreement with DICTRA [14] simulations usingthe same set <strong>of</strong> data. The DICTRA simulations arebased on a sharp interface model and local equilibriumat the interface. At the same temperature acompletely different behavior is found for an alloywith uCg 0.001. In this case the massive growthoccurred with a constant growth rate <strong>of</strong> ca. 0.1 m/sFig. 1. <strong>Phase</strong>-<strong>field</strong> calculation <strong>of</strong> carbon concentration pr<strong>of</strong>ilesat different instances, t = 1, 10, 20,… 60 s. u gC 0.01 at T =1093 K.Fig. 2. <strong>Phase</strong>-<strong>field</strong> calculation <strong>of</strong> half-thickness <strong>of</strong> ferrite precipitateas function <strong>of</strong> √t.until all g was transformed into a. The concentrationpr<strong>of</strong>ile, a traveling wave, is shown in Fig. 3.By performing <strong>phase</strong>-<strong>field</strong> simulations for alarge number <strong>of</strong> alloy compositions at each tem-