Phase-field modeling of diffusion controlled phase ... - KTH Mechanics
Phase-field modeling of diffusion controlled phase ... - KTH Mechanics
Phase-field modeling of diffusion controlled phase ... - KTH Mechanics

You also want an ePaper? Increase the reach of your titles
YUMPU automatically turns print PDFs into web optimized ePapers that Google loves.
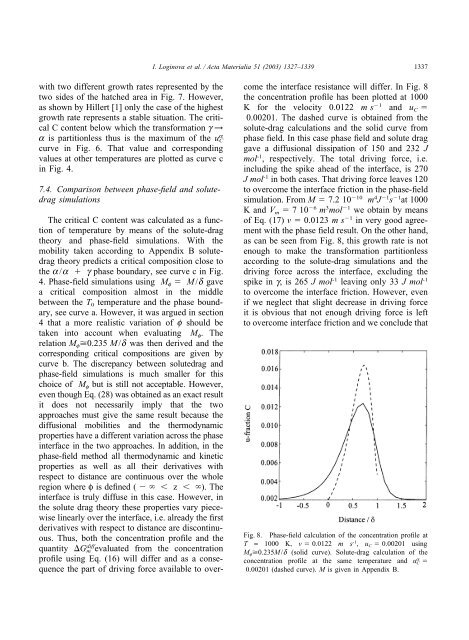
I. Loginova et al. / Acta Materialia 51 (2003) 1327–13391337with two different growth rates represented by thetwo sides <strong>of</strong> the hatched area in Fig. 7. However,as shown by Hillert [1] only the case <strong>of</strong> the highestgrowth rate represents a stable situation. The criticalC content below which the transformation g →a is partitionless thus is the maximum <strong>of</strong> the u a Ccurve in Fig. 6. That value and correspondingvalues at other temperatures are plotted as curve cin Fig. 4.7.4. Comparison between <strong>phase</strong>-<strong>field</strong> and solutedragsimulationsThe critical C content was calculated as a function<strong>of</strong> temperature by means <strong>of</strong> the solute-dragtheory and <strong>phase</strong>-<strong>field</strong> simulations. With themobility taken according to Appendix B solutedragtheory predicts a critical composition close tothe a/a g <strong>phase</strong> boundary, see curve c in Fig.4. <strong>Phase</strong>-<strong>field</strong> simulations using M f M/d gavea critical composition almost in the middlebetween the T 0 temperature and the <strong>phase</strong> boundary,see curve a. However, it was argued in section4 that a more realistic variation <strong>of</strong> f should betaken into account when evaluating M f . Therelation M f 0.235 M/d was then derived and thecorresponding critical compositions are given bycurve b. The discrepancy between solutedrag and<strong>phase</strong>-<strong>field</strong> simulations is much smaller for thischoice <strong>of</strong> M f but is still not acceptable. However,even though Eq. (28) was obtained as an exact resultit does not necessarily imply that the twoapproaches must give the same result because the<strong>diffusion</strong>al mobilities and the thermodynamicproperties have a different variation across the <strong>phase</strong>interface in the two approaches. In addition, in the<strong>phase</strong>-<strong>field</strong> method all thermodynamic and kineticproperties as well as all their derivatives withrespect to distance are continuous over the wholeregion where φ is defined ( z ). Theinterface is truly diffuse in this case. However, inthe solute drag theory these properties vary piecewiselinearly over the interface, i.e. already the firstderivatives with respect to distance are discontinuous.Thus, both the concentration pr<strong>of</strong>ile and thequantity G diffm evaluated from the concentrationpr<strong>of</strong>ile using Eq. (16) will differ and as a consequencethe part <strong>of</strong> driving force available to overcomethe interface resistance will differ. In Fig. 8the concentration pr<strong>of</strong>ile has been plotted at 1000K for the velocity 0.0122 ms 1 and u C 0.00201. The dashed curve is obtained from thesolute-drag calculations and the solid curve from<strong>phase</strong> <strong>field</strong>. In this case <strong>phase</strong> <strong>field</strong> and solute draggave a <strong>diffusion</strong>al dissipation <strong>of</strong> 150 and 232 Jmol -1 , respectively. The total driving force, i.e.including the spike ahead <strong>of</strong> the interface, is 270Jmol -1 in both cases. That driving force leaves 120to overcome the interface friction in the <strong>phase</strong>-<strong>field</strong>simulation. From M 7.2 10 10 m 4 J 1 s 1 at 1000K and V m 710 6 m 3 mol 1 we obtain by means<strong>of</strong> Eq. (17) v 0.0123 ms 1 in very good agreementwith the <strong>phase</strong> <strong>field</strong> result. On the other hand,as can be seen from Fig. 8, this growth rate is notenough to make the transformation partitionlessaccording to the solute-drag simulations and thedriving force across the interface, excluding thespike in g, is 265 Jmol -1 leaving only 33 Jmol -1to overcome the interface friction. However, evenif we neglect that slight decrease in driving forceit is obvious that not enough driving force is leftto overcome interface friction and we conclude thatFig. 8. <strong>Phase</strong>-<strong>field</strong> calculation <strong>of</strong> the concentration pr<strong>of</strong>ile atT = 1000 K, v 0.0122 m s -1 , u C 0.00201 usingM f 0.235M/d (solid curve). Solute-drag calculation <strong>of</strong> theconcentration pr<strong>of</strong>ile at the same temperature and u a C 0.00201 (dashed curve). M is given in Appendix B.