Office of the Premier Annual Report 2009-2010 - Gauteng Online
Office of the Premier Annual Report 2009-2010 - Gauteng Online
Office of the Premier Annual Report 2009-2010 - Gauteng Online

You also want an ePaper? Increase the reach of your titles
YUMPU automatically turns print PDFs into web optimized ePapers that Google loves.
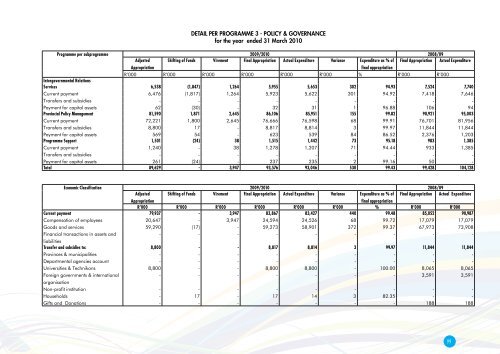
DETAIL PER PROGRAMME 3 - POLICY & GOVERNANCEfor <strong>the</strong> year ended 31 March <strong>2010</strong>Programme per subprogramme <strong>2009</strong>/<strong>2010</strong> 2008/09Adjusted Shifting <strong>of</strong> Funds Virement Final Appropriation Actual Expenditure Variance Expenditure as % <strong>of</strong> Final Appropriation Actual ExpenditureAppropriationfinal appropriationR’000 R’000 R’000 R’000 R’000 R’000 % R’000 R’000Intergovernmental RelationsServices 6,538 (1,847) 1,264 5,955 5,653 302 94.93 7,524 7,740Current payment 6,476 (1,817) 1,264 5,923 5,622 301 94.92 7,418 7,646Transfers and subsidies - - - - - - - - -Payment for capital assets 62 (30) - 32 31 1 96.88 106 94Provincial Policy Management 81,590 1,871 2,645 86,106 85,951 155 99.82 90,921 95,003Current payment 72,221 1,800 2,645 76,666 76,598 68 99.91 76,701 81,956Transfers and subsidies 8,800 17 - 8,817 8,814 3 99.97 11,844 11,844Payment for capital assets 569 54 - 623 539 84 86.52 2,376 1,203Programme Support 1,501 (24) 38 1,515 1,442 73 95.18 983 1,385Current payment 1,240 - 38 1,278 1,207 71 94.44 933 1,385Transfers and subsidies - - - - - - - - -Payment for capital assets 261 (24) - 237 235 2 99.16 50 -Total 89,629 - 3,947 93,576 93,046 530 99.43 99,428 104,128Economic Classification <strong>2009</strong>/<strong>2010</strong> 2008/09Adjusted Shifting <strong>of</strong> Funds Virement Final Appropriation Actual Expenditure Variance Expenditure as % <strong>of</strong> Final Appropriation Actual ExpenditureAppropriationfinal appropriationR’000 R’000 R’000 R’000 R’000 R’000 % R’000 R’000Current payment 79,937 - 3,947 83,867 83,427 440 99.48 85,052 90,987Compensation <strong>of</strong> employees 20,647 - 3,947 24,594 24,526 68 99.72 17,079 17,079Goods and services 59,290 (17) - 59,273 58,901 372 99.37 67,973 73,908Financial transactions in assets and- - - - - - - - -liabilitiesTransfer and subsidies to: 8,800 - - 8,817 8,814 3 99.97 11,844 11,844Provinces & municipalities - - - - - - - - -Departmental agencies account - - - - - - - - -Universities & Technikons 8,800 - - 8,800 8,800 - 100.00 8,065 8,065Foreign governments & international- - - - - - - 3,591 3,591organisationNon-pr<strong>of</strong>it institution - - - - - - - - -Households - 17 - 17 14 3 82.35 - -Gifts and Donations - - - - - - - 188 18899