

UWE Bristol Engineering showcase 2015

You also want an ePaper? Increase the reach of your titles
YUMPU automatically turns print PDFs into web optimized ePapers that Google loves.
David R Irvine<br />
Bsc <strong>Engineering</strong><br />
Project Supervisor<br />
Rui Cardosso<br />
The M-K Analysis and its Accuracy at Determining Sheet Metal Ductility<br />
Limits via Forming Limit Diagrams.<br />
Introduction<br />
The Forming Limit Diagram (FLD) outlines the ductility limits of a specific sheet metal in reference to the principle in plane strain<br />
directions . These diagrams allow for designer and manufacturers alike to determine if a material or process is capable of being made.<br />
The report for this project details the various methods of procuring the necessary data to create these diagrams along with methods to<br />
construct the curve. A series of ABAQUS models were used to carry out numerical analysis to determine its effectiveness.<br />
Theoretical modelling<br />
The Marciniak-Kuczynski Model is a broadly excepted way of modelling inhomogeneity<br />
in sheet metal it does this by creating a groove (seen right) through the model with a<br />
different thickness to the rest of the model usually between 90% and 99% of the<br />
original thickness . If this sheet is then subjected to a critical load the necking will<br />
originated in this new groove area.<br />
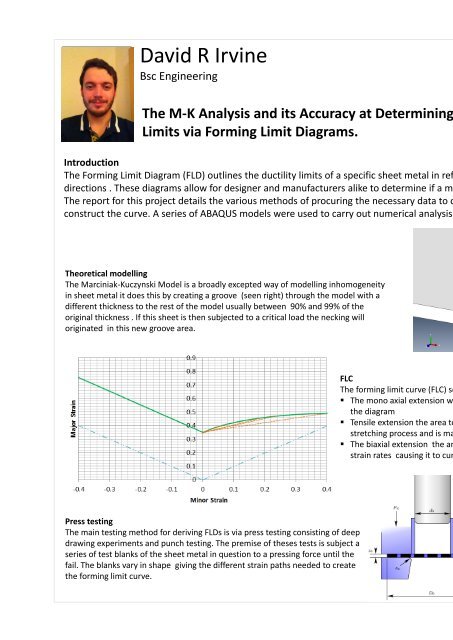
FLC<br />
The forming limit curve (FLC) seen left, consists of three main sections:<br />
• The mono axial extension where minor strain is 0 this is usual the lowest point on<br />
the diagram<br />
• Tensile extension the area to the left of the y axis depicting the sheet under a<br />
stretching process and is mainly straight .<br />
• The biaxial extension the area to the right of the y axis consists of many different<br />
strain rates causing it to curve and depicts such things as stamping.<br />
Project summary<br />
This project compare d the capabilities,<br />
accuracy and ease of creating FLDs with a<br />
variety of methods including simulations and<br />
physical experiment<br />
Project Objectives<br />
The project set out to observe the pros and<br />
cons of each analytical method, outline the<br />
methodology behind these processes<br />
Project Conclusion<br />
This project found while there are many<br />
methods to create forming limit diagrams<br />
some are better suited to certain situations<br />
like deep drawing in useful when dealing<br />
with highly plastic metals and hemispherical<br />
punch is well suited to thin brittle sheets. FEA<br />
solutions are great but definitely need some<br />
kind of physical experiment behind them to<br />
validate the strain localization location. And<br />
assist in geometry decisions.<br />
Press testing<br />
The main testing method for deriving FLDs is via press testing consisting of deep<br />
drawing experiments and punch testing. The premise of theses tests is subject a<br />
series of test blanks of the sheet metal in question to a pressing force until the<br />
fail. The blanks vary in shape giving the different strain paths needed to create<br />
the forming limit curve.