- Page 1 and 2:
TOXICOLOGICAL PROFILE FOR MERCURY U
- Page 3:
MERCURY UPDATE STATEMENT A Toxicolo
- Page 8 and 9:
MERCURY Managing Hazardous Material
- Page 11:
MERCURY PEER REVIEW A peer review p
- Page 14 and 15:
MERCURY 2.2.3 Dermal Exposure .....
- Page 16 and 17:
MERCURY xvi APPENDICES B. ATSDR MIN
- Page 19 and 20:
MERCURY LIST OF TABLES 2-1 Levels o
- Page 21 and 22:
MERCURY 1. PUBLIC HEALTH STATEMENT
- Page 23 and 24:
MERCURY 1. PUBLIC HEALTH STATEMENT
- Page 25 and 26:
MERCURY 1. PUBLIC HEALTH STATEMENT
- Page 27 and 28:
MERCURY 1. PUBLIC HEALTH STATEMENT
- Page 29 and 30:
MERCURY 1. PUBLIC HEALTH STATEMENT
- Page 31 and 32:
MERCURY 1. PUBLIC HEALTH STATEMENT
- Page 33 and 34:
MERCURY 1. PUBLIC HEALTH STATEMENT
- Page 35 and 36:
MERCURY 1. PUBLIC HEALTH STATEMENT
- Page 37 and 38:
MERCURY 1. PUBLIC HEALTH STATEMENT
- Page 39 and 40:
MERCURY 1. PUBLIC HEALTH STATEMENT
- Page 41 and 42:
MERCURY 1. PUBLIC HEALTH STATEMENT
- Page 43 and 44:
MERCURY 1. PUBLIC HEALTH STATEMENT
- Page 45 and 46:
MERCURY 1. PUBLIC HEALTH STATEMENT
- Page 47 and 48:
MERCURY 1. PUBLIC HEALTH STATEMENT
- Page 49 and 50:
MERCURY 2.1 INTRODUCTION 2. HEALTH
- Page 51 and 52:
MERCURY 2. HEALTH EFFECTS This prof
- Page 53 and 54:
MERCURY 2. HEALTH EFFECTS bronchiti
- Page 63 and 64:
MERCURY 2. HEALTH EFFECTS A 39-year
- Page 65 and 66:
MERCURY 2. HEALTH EFFECTS effects o
- Page 67 and 68:
MERCURY Gastrointestinal Effects 2.
- Page 69 and 70:
MERCURY 2. HEALTH EFFECTS home as a
- Page 71 and 72:
MERCURY Renal Effects 2. HEALTH EFF
- Page 73 and 74:
MERCURY 2. HEALTH EFFECTS pathologi
- Page 75 and 76:
MERCURY Ocular Effects 2. HEALTH EF
- Page 77 and 78:
MERCURY 2. HEALTH EFFECTS the T-cel
- Page 79 and 80:
MERCURY 2. HEALTH EFFECTS In case r
- Page 81 and 82:
MERCURY 2. HEALTH EFFECTS A 27-year
- Page 83 and 84:
MERCURY 2. HEALTH EFFECTS The TWA m
- Page 85 and 86:
MERCURY 2. HEALTH EFFECTS reversibl
- Page 87 and 88:
MERCURY 2.2.1.5 Reproductive Effect
- Page 89 and 90:
MERCURY 2.2.1.6 Developmental Effec
- Page 91 and 92:
MERCURY 2. HEALTH EFFECTS acquiring
- Page 93 and 94:
MERCURY 2. HEALTH EFFECTS control s
- Page 95:
MERCURY 2. HEALTH EFFECTS compounds
- Page 125 and 126:
MERCURY 105 2. HEALTH EFFECTS chlor
- Page 127 and 128:
MERCURY 107 2. HEALTH EFFECTS diffe
- Page 129 and 130:
MERCURY 109 2. HEALTH EFFECTS chlor
- Page 131 and 132:
MERCURY 111 Musculoskeletal Effects
- Page 133 and 134:
MERCURY 113 Renal Effects 2. HEALTH
- Page 135 and 136:
MERCURY 115 2. HEALTH EFFECTS (dila
- Page 137 and 138:
MERCURY 117 2. HEALTH EFFECTS glome
- Page 139 and 140:
MERCURY 119 Dermal Effects 2. HEALT
- Page 141 and 142:
MERCURY 121 2. HEALTH EFFECTS The o
- Page 143 and 144:
MERCURY 123 2. HEALTH EFFECTS Organ
- Page 145 and 146:
MERCURY 125 2. HEALTH EFFECTS forge
- Page 147 and 148:
MERCURY 127 2. HEALTH EFFECTS occur
- Page 149 and 150:
MERCURY 129 2. HEALTH EFFECTS hypot
- Page 151 and 152:
MERCURY 131 2. HEALTH EFFECTS any e
- Page 153 and 154:
MERCURY 133 2. HEALTH EFFECTS in th
- Page 155 and 156:
MERCURY 135 2. HEALTH EFFECTS paral
- Page 157 and 158:
MERCURY 137 2. HEALTH EFFECTS as lo
- Page 159 and 160:
MERCURY 139 2. HEALTH EFFECTS Pregn
- Page 161 and 162:
MERCURY 141 2. HEALTH EFFECTS dysar
- Page 163 and 164:
MERCURY 143 2. HEALTH EFFECTS >12 p
- Page 165 and 166:
MERCURY 145 2. HEALTH EFFECTS Tempo
- Page 167 and 168:
MERCURY 147 2. HEALTH EFFECTS less
- Page 169 and 170:
MERCURY 149 2. HEALTH EFFECTS admin
- Page 171 and 172:
MERCURY 151 2. HEALTH EFFECTS Hg/kg
- Page 173 and 174:
MERCURY 153 2. HEALTH EFFECTS incre
- Page 175 and 176:
MERCURY 155 2. HEALTH EFFECTS is li
- Page 177 and 178:
MERCURY 157 2. HEALTH EFFECTS ulcer
- Page 179 and 180:
MERCURY 159 2. HEALTH EFFECTS patie
- Page 181 and 182:
MERCURY 161 2. HEALTH EFFECTS No st
- Page 183 and 184:
MERCURY 163 2.3.1.1 Inhalation Expo
- Page 185 and 186:
MERCURY 165 2. HEALTH EFFECTS was m
- Page 187 and 188:
MERCURY 167 2. HEALTH EFFECTS (1 mg
- Page 189 and 190:
MERCURY 169 2.3.1.3 Dermal Exposure
- Page 191 and 192:
MERCURY 171 2. HEALTH EFFECTS decli
- Page 193 and 194:
MERCURY 173 2. HEALTH EFFECTS prima
- Page 195 and 196:
MERCURY 175 2. HEALTH EFFECTS follo
- Page 197 and 198:
MERCURY 177 2. HEALTH EFFECTS methy
- Page 199 and 200:
MERCURY 179 2. HEALTH EFFECTS 1992;
- Page 201 and 202:
MERCURY 181 2. HEALTH EFFECTS side
- Page 203 and 204:
MERCURY 183 2. HEALTH EFFECTS pathw
- Page 205 and 206:
MERCURY 185 2.3.4 Elimination and E
- Page 208 and 209:
MERCURY 188 2. HEALTH EFFECTS worke
- Page 210:
MERCURY 190 2. HEALTH EFFECTS Rowla
- Page 213 and 214:
MERCURY 193 2. HEALTH EFFECTS 2.3.5
- Page 216:
MERCURY 196 2. HEALTH EFFECTS dosin
- Page 220 and 221:
MERCURY 200 2. HEALTH EFFECTS did o
- Page 226 and 227:
MERCURY 206 2. HEALTH EFFECTS reabs
- Page 228 and 229:
MERCURY 208 2. HEALTH EFFECTS Oral
- Page 230 and 231:
MERCURY 210 2. HEALTH EFFECTS Strai
- Page 232 and 233:
MERCURY 212 2. HEALTH EFFECTS enzym
- Page 234 and 235:
MERCURY 214 2. HEALTH EFFECTS Recen
- Page 236 and 237:
MERCURY 216 2. HEALTH EFFECTS 1995)
- Page 238 and 239:
MERCURY 218 2. HEALTH EFFECTS autoa
- Page 240 and 241:
MERCURY 220 2.5 RELEVANCE TO PUBLIC
- Page 242 and 243:
MERCURY 222 2. HEALTH EFFECTS Pheny
- Page 244 and 245:
MERCURY 224 2. HEALTH EFFECTS mercu
- Page 246 and 247:
MERCURY 226 2. HEALTH EFFECTS nonst
- Page 248 and 249:
MERCURY 228 2. HEALTH EFFECTS appre
- Page 250 and 251:
MERCURY 230 2. HEALTH EFFECTS the M
- Page 252 and 253:
MERCURY 232 2. HEALTH EFFECTS Emplo
- Page 254 and 255:
MERCURY 234 C 2. HEALTH EFFECTS and
- Page 256 and 257:
MERCURY 236 2. HEALTH EFFECTS Nakag
- Page 258 and 259:
MERCURY 238 2. HEALTH EFFECTS • (
- Page 260 and 261:
MERCURY 240 Supporting Studies 2. H
- Page 262 and 263:
MERCURY 242 2. HEALTH EFFECTS and e
- Page 264 and 265:
MERCURY 244 2. HEALTH EFFECTS the h
- Page 266 and 267:
MERCURY 246 2. HEALTH EFFECTS the m
- Page 268 and 269:
MERCURY 248 2. HEALTH EFFECTS Iraqi
- Page 271 and 272:
MERCURY 251 2. HEALTH EFFECTS al. (
- Page 273 and 274:
MERCURY 253 2. HEALTH EFFECTS The a
- Page 275 and 276:
MERCURY 255 2. HEALTH EFFECTS The N
- Page 277 and 278:
MERCURY 257 2. HEALTH EFFECTS NOAEL
- Page 279:
MERCURY 259 2. HEALTH EFFECTS where
- Page 282 and 283:
MERCURY 262 2. HEALTH EFFECTS they
- Page 284 and 285: MERCURY 264 2. HEALTH EFFECTS Anima
- Page 286 and 287: MERCURY 266 2. HEALTH EFFECTS acute
- Page 288 and 289: MERCURY 268 2. HEALTH EFFECTS and d
- Page 290 and 291: MERCURY 270 2. HEALTH EFFECTS Rowen
- Page 292 and 293: MERCURY 272 2. HEALTH EFFECTS Tunne
- Page 294 and 295: MERCURY 274 2. HEALTH EFFECTS 1992;
- Page 296 and 297: MERCURY 276 2. HEALTH EFFECTS Neuro
- Page 298 and 299: MERCURY 278 2. HEALTH EFFECTS serot
- Page 300 and 301: MERCURY 280 2. HEALTH EFFECTS (0.06
- Page 302 and 303: MERCURY 282 2. HEALTH EFFECTS Devel
- Page 304 and 305: MERCURY 284 2. HEALTH EFFECTS The i
- Page 308 and 309: MERCURY 288 2. HEALTH EFFECTS mercu
- Page 312 and 313: MERCURY 292 2. HEALTH EFFECTS Cance
- Page 314 and 315: MERCURY 294 2. HEALTH EFFECTS numbe
- Page 316 and 317: MERCURY 296 2. HEALTH EFFECTS of in
- Page 318 and 319: MERCURY 298 2. HEALTH EFFECTS Studi
- Page 320 and 321: MERCURY 300 2. HEALTH EFFECTS or ot
- Page 322 and 323: MERCURY 302 2. HEALTH EFFECTS Wheth
- Page 324 and 325: MERCURY 304 2. HEALTH EFFECTS Acute
- Page 326 and 327: MERCURY 306 2. HEALTH EFFECTS appar
- Page 328 and 329: MERCURY 308 2. HEALTH EFFECTS most
- Page 330 and 331: MERCURY 310 2. HEALTH EFFECTS Conce
- Page 332 and 333: MERCURY 312 2. HEALTH EFFECTS The m
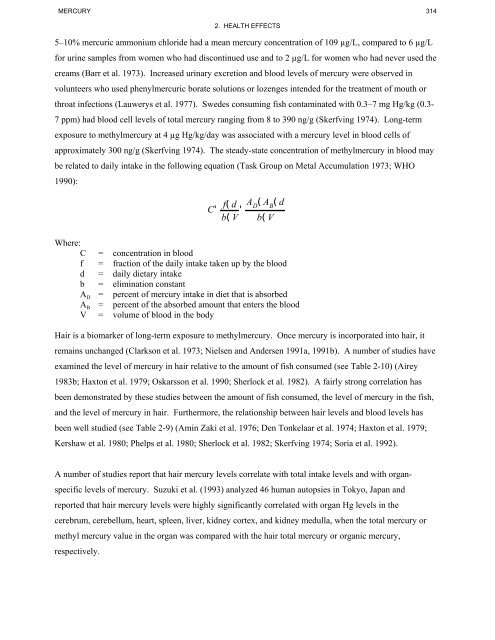
- Page 336 and 337: MERCURY 316 2. HEALTH EFFECTS Japan
- Page 340 and 341: MERCURY 320 2. HEALTH EFFECTS dysfu
- Page 342 and 343: MERCURY 322 2. HEALTH EFFECTS mercu
- Page 344 and 345: MERCURY 324 2. HEALTH EFFECTS selen
- Page 346 and 347: MERCURY 326 2. HEALTH EFFECTS at do
- Page 348 and 349: MERCURY 328 2. HEALTH EFFECTS Proba
- Page 350 and 351: MERCURY 330 2. HEALTH EFFECTS parti
- Page 352 and 353: MERCURY 332 2. HEALTH EFFECTS is me
- Page 354 and 355: MERCURY 334 2. HEALTH EFFECTS 2.10.
- Page 360 and 361: MERCURY 340 2. HEALTH EFFECTS Infor
- Page 362 and 363: MERCURY 342 2. HEALTH EFFECTS Acute
- Page 364 and 365: MERCURY 344 2. HEALTH EFFECTS chron
- Page 366 and 367: MERCURY 346 2. HEALTH EFFECTS Repro
- Page 368 and 369: MERCURY 348 2. HEALTH EFFECTS might
- Page 370 and 371: MERCURY 350 2. HEALTH EFFECTS corre
- Page 372 and 373: MERCURY 352 2. HEALTH EFFECTS In ge
- Page 374 and 375: MERCURY 354 2. HEALTH EFFECTS initi
- Page 376 and 377: MERCURY 356 2. HEALTH EFFECTS The m
- Page 383: MERCURY 363 3.1 CHEMICAL IDENTITY 3
- Page 394 and 395:
MERCURY 374 4. PRODUCTION, IMPORT/E
- Page 396 and 397:
MERCURY 376 4. PRODUCTION, IMPORT/E
- Page 398 and 399:
MERCURY 378 4. PRODUCTION, IMPORT/E
- Page 400:
MERCURY 380 5. POTENTIAL FOR HUMAN
- Page 409 and 410:
MERCURY 389 5. POTENTIAL FOR HUMAN
- Page 411:
MERCURY 391 5. POTENTIAL FOR HUMAN
- Page 416:
MERCURY 396 5.2.3 Soil 5. POTENTIAL
- Page 419 and 420:
MERCURY 399 5. POTENTIAL FOR HUMAN
- Page 421:
MERCURY 401 5. POTENTIAL FOR HUMAN
- Page 425 and 426:
MERCURY 405 5. POTENTIAL FOR HUMAN
- Page 428 and 429:
MERCURY 408 5. POTENTIAL FOR HUMAN
- Page 430 and 431:
MERCURY 410 5. POTENTIAL FOR HUMAN
- Page 432 and 433:
MERCURY 412 5. POTENTIAL FOR HUMAN
- Page 434 and 435:
MERCURY 414 5. POTENTIAL FOR HUMAN
- Page 436 and 437:
MERCURY 416 5. POTENTIAL FOR HUMAN
- Page 438 and 439:
MERCURY 418 5. POTENTIAL FOR HUMAN
- Page 442:
MERCURY 422 5. POTENTIAL FOR HUMAN
- Page 445:
MERCURY 425 5. POTENTIAL FOR HUMAN
- Page 448 and 449:
MERCURY 428 5. POTENTIAL FOR HUMAN
- Page 450 and 451:
MERCURY 430 5. POTENTIAL FOR HUMAN
- Page 453 and 454:
MERCURY 433 5. POTENTIAL FOR HUMAN
- Page 459 and 460:
MERCURY 439 5. POTENTIAL FOR HUMAN
- Page 462 and 463:
MERCURY 442 5. POTENTIAL FOR HUMAN
- Page 465 and 466:
MERCURY 445 5. POTENTIAL FOR HUMAN
- Page 469:
MERCURY 449 5. POTENTIAL FOR HUMAN
- Page 472 and 473:
MERCURY 452 5. POTENTIAL FOR HUMAN
- Page 474:
MERCURY 454 5. POTENTIAL FOR HUMAN
- Page 478 and 479:
MERCURY 458 5. POTENTIAL FOR HUMAN
- Page 480 and 481:
MERCURY 460 5. POTENTIAL FOR HUMAN
- Page 482 and 483:
MERCURY 462 5. POTENTIAL FOR HUMAN
- Page 484 and 485:
MERCURY 464 5. POTENTIAL FOR HUMAN
- Page 486 and 487:
MERCURY 466 5. POTENTIAL FOR HUMAN
- Page 488 and 489:
MERCURY 468 5. POTENTIAL FOR HUMAN
- Page 491 and 492:
MERCURY 471 5. POTENTIAL FOR HUMAN
- Page 493 and 494:
MERCURY 473 5. POTENTIAL FOR HUMAN
- Page 495 and 496:
MERCURY 475 5. POTENTIAL FOR HUMAN
- Page 497 and 498:
MERCURY 477 5. POTENTIAL FOR HUMAN
- Page 499 and 500:
MERCURY 479 5. POTENTIAL FOR HUMAN
- Page 501 and 502:
MERCURY 481 5. POTENTIAL FOR HUMAN
- Page 507 and 508:
MERCURY 487 6. ANALYTICAL METHODS T
- Page 512 and 513:
MERCURY 492 6. ANALYTICAL METHODS (
- Page 514 and 515:
MERCURY 494 6. ANALYTICAL METHODS S
- Page 523 and 524:
MERCURY 503 6. ANALYTICAL METHODS w
- Page 525 and 526:
MERCURY 505 6. ANALYTICAL METHODS T
- Page 529 and 530:
MERCURY 509 7. REGULATIONS AND ADVI
- Page 531 and 532:
MERCURY 511 7. REGULATIONS AND ADVI
- Page 533 and 534:
MERCURY 513 7. REGULATIONS AND ADVI
- Page 545 and 546:
MERCURY 525 8. REFERENCES *Abbas MN
- Page 547 and 548:
MERCURY 527 8. REFERENCES *Allard B
- Page 549 and 550:
MERCURY 529 8. REFERENCES *Aten J,
- Page 551 and 552:
MERCURY 531 8. REFERENCES *Barnes D
- Page 553 and 554:
MERCURY 533 8. REFERENCES *Berlin M
- Page 555 and 556:
MERCURY 535 8. REFERENCES *Bloom NS
- Page 557 and 558:
MERCURY 537 8. REFERENCES *Bullock
- Page 559 and 560:
MERCURY 539 8. REFERENCES *Castedo
- Page 561 and 562:
MERCURY 541 8. REFERENCES *Christie
- Page 563 and 564:
MERCURY 543 8. REFERENCES *Cordier
- Page 565 and 566:
MERCURY 545 8. REFERENCES *DeBont B
- Page 567 and 568:
MERCURY 547 8. REFERENCES *Dutczak
- Page 569 and 570:
MERCURY 549 8. REFERENCES *EPA. 198
- Page 571 and 572:
MERCURY 551 8. REFERENCES *EPA. 199
- Page 573 and 574:
MERCURY 553 8. REFERENCES *Erfurth
- Page 575 and 576:
MERCURY 555 8. REFERENCES *Fleming
- Page 577 and 578:
MERCURY 557 8. REFERENCES *Ganser A
- Page 579 and 580:
MERCURY 559 8. REFERENCES *Goldman
- Page 581 and 582:
MERCURY 561 8. REFERENCES *Gutenman
- Page 583 and 584:
MERCURY 563 8. REFERENCES *Hill W.
- Page 585 and 586:
MERCURY 565 8. REFERENCES *IARC 199
- Page 587 and 588:
MERCURY 567 8. REFERENCES *Jokstad
- Page 589 and 590:
MERCURY 569 8. REFERENCES *King G.
- Page 591 and 592:
MERCURY 571 8. REFERENCES *Lauwerys
- Page 593 and 594:
MERCURY 573 8. REFERENCES *Lindqvis
- Page 595 and 596:
MERCURY 575 8. REFERENCES *Lytle TF
- Page 597 and 598:
MERCURY 577 8. REFERENCES *Matsumot
- Page 599 and 600:
MERCURY 579 8. REFERENCES Mishonova
- Page 601 and 602:
MERCURY 581 8. REFERENCES *Naganuma
- Page 603 and 604:
MERCURY 583 8. REFERENCES *Nieschmi
- Page 605 and 606:
MERCURY 585 8. REFERENCES *Odukoya
- Page 607 and 608:
MERCURY 587 8. REFERENCES *Pelletie
- Page 609 and 610:
MERCURY 589 8. REFERENCES *Prouvost
- Page 611 and 612:
MERCURY 591 8. REFERENCES *Rice DC.
- Page 613 and 614:
MERCURY 593 8. REFERENCES *Sager PR
- Page 615 and 616:
MERCURY 595 8. REFERENCES *Sedman R
- Page 617 and 618:
MERCURY 597 8. REFERENCES *Skare I,
- Page 619 and 620:
MERCURY 599 8. REFERENCES *Stutz DR
- Page 621 and 622:
MERCURY 601 8. REFERENCES *Thomas D
- Page 623 and 624:
MERCURY 603 8. REFERENCES *Van der
- Page 625 and 626:
MERCURY 605 8. REFERENCES *Warfving
- Page 627 and 628:
MERCURY 607 8. REFERENCES *Willes R
- Page 629 and 630:
MERCURY 609 8. REFERENCES *Yeoh TS,
- Page 631 and 632:
MERCURY 611 9. GLOSSARY Absorption
- Page 633 and 634:
MERCURY 613 9. GLOSSARY Incidence
- Page 635 and 636:
MERCURY 615 9. GLOSSARY Physiologic
- Page 637:
MERCURY 617 9. GLOSSARY Uncertainty
- Page 640 and 641:
MERCURY A-2 APPENDIX A MRLs are int
- Page 642 and 643:
MERCURY A-4 APPENDIX A Was a conver
- Page 644 and 645:
MERCURY A-6 APPENDIX A MINIMAL RISK
- Page 646 and 647:
MERCURY A-8 APPENDIX A MINIMAL RISK
- Page 648 and 649:
MERCURY A-10 APPENDIX A MINIMAL RIS
- Page 650 and 651:
MERCURY A-12 Converting blood conce
- Page 652 and 653:
MERCURY A-14 APPENDIX A dose in the
- Page 654 and 655:
MERCURY A-16 APPENDIX A possibility
- Page 656 and 657:
MERCURY A-18 APPENDIX A Seychelles
- Page 658 and 659:
MERCURY A-20 APPENDIX A panel that
- Page 660 and 661:
MERCURY A-22 APPENDIX A fish-eating
- Page 662 and 663:
MERCURY A-24 APPENDIX A pharmacokin
- Page 664 and 665:
MERCURY B-2 APPENDIX B (2) Exposure
- Page 666:
1 SAMPLE 6 TABLE 2-1. Levels of Sig
- Page 669:
MERCURY B-7 APPENDIX B To derive an
- Page 672 and 673:
MERCURY C-2 APPENDIX C ECD electron
- Page 674 and 675:
MERCURY C-4 APPENDIX C PAH Polycycl


