- Page 1 and 2:
TOXICOLOGICAL PROFILE FOR MERCURY U
- Page 3:
MERCURY UPDATE STATEMENT A Toxicolo
- Page 8 and 9:
MERCURY Managing Hazardous Material
- Page 11:
MERCURY PEER REVIEW A peer review p
- Page 14 and 15:
MERCURY 2.2.3 Dermal Exposure .....
- Page 16 and 17:
MERCURY xvi APPENDICES B. ATSDR MIN
- Page 19 and 20:
MERCURY LIST OF TABLES 2-1 Levels o
- Page 21 and 22:
MERCURY 1. PUBLIC HEALTH STATEMENT
- Page 23 and 24:
MERCURY 1. PUBLIC HEALTH STATEMENT
- Page 25 and 26:
MERCURY 1. PUBLIC HEALTH STATEMENT
- Page 27 and 28:
MERCURY 1. PUBLIC HEALTH STATEMENT
- Page 29 and 30:
MERCURY 1. PUBLIC HEALTH STATEMENT
- Page 31 and 32:
MERCURY 1. PUBLIC HEALTH STATEMENT
- Page 33 and 34:
MERCURY 1. PUBLIC HEALTH STATEMENT
- Page 35 and 36:
MERCURY 1. PUBLIC HEALTH STATEMENT
- Page 37 and 38:
MERCURY 1. PUBLIC HEALTH STATEMENT
- Page 39 and 40:
MERCURY 1. PUBLIC HEALTH STATEMENT
- Page 41 and 42:
MERCURY 1. PUBLIC HEALTH STATEMENT
- Page 43 and 44:
MERCURY 1. PUBLIC HEALTH STATEMENT
- Page 45 and 46:
MERCURY 1. PUBLIC HEALTH STATEMENT
- Page 47 and 48:
MERCURY 1. PUBLIC HEALTH STATEMENT
- Page 49 and 50:
MERCURY 2.1 INTRODUCTION 2. HEALTH
- Page 51 and 52:
MERCURY 2. HEALTH EFFECTS This prof
- Page 53 and 54:
MERCURY 2. HEALTH EFFECTS bronchiti
- Page 63 and 64:
MERCURY 2. HEALTH EFFECTS A 39-year
- Page 65 and 66:
MERCURY 2. HEALTH EFFECTS effects o
- Page 67 and 68:
MERCURY Gastrointestinal Effects 2.
- Page 69 and 70:
MERCURY 2. HEALTH EFFECTS home as a
- Page 71 and 72:
MERCURY Renal Effects 2. HEALTH EFF
- Page 73 and 74:
MERCURY 2. HEALTH EFFECTS pathologi
- Page 75 and 76:
MERCURY Ocular Effects 2. HEALTH EF
- Page 77 and 78:
MERCURY 2. HEALTH EFFECTS the T-cel
- Page 79 and 80:
MERCURY 2. HEALTH EFFECTS In case r
- Page 81 and 82:
MERCURY 2. HEALTH EFFECTS A 27-year
- Page 83 and 84:
MERCURY 2. HEALTH EFFECTS The TWA m
- Page 85 and 86:
MERCURY 2. HEALTH EFFECTS reversibl
- Page 87 and 88:
MERCURY 2.2.1.5 Reproductive Effect
- Page 89 and 90:
MERCURY 2.2.1.6 Developmental Effec
- Page 91 and 92:
MERCURY 2. HEALTH EFFECTS acquiring
- Page 93 and 94:
MERCURY 2. HEALTH EFFECTS control s
- Page 95:
MERCURY 2. HEALTH EFFECTS compounds
- Page 125 and 126:
MERCURY 105 2. HEALTH EFFECTS chlor
- Page 127 and 128:
MERCURY 107 2. HEALTH EFFECTS diffe
- Page 129 and 130:
MERCURY 109 2. HEALTH EFFECTS chlor
- Page 131 and 132:
MERCURY 111 Musculoskeletal Effects
- Page 133 and 134:
MERCURY 113 Renal Effects 2. HEALTH
- Page 135 and 136:
MERCURY 115 2. HEALTH EFFECTS (dila
- Page 137 and 138:
MERCURY 117 2. HEALTH EFFECTS glome
- Page 139 and 140:
MERCURY 119 Dermal Effects 2. HEALT
- Page 141 and 142:
MERCURY 121 2. HEALTH EFFECTS The o
- Page 143 and 144:
MERCURY 123 2. HEALTH EFFECTS Organ
- Page 145 and 146:
MERCURY 125 2. HEALTH EFFECTS forge
- Page 147 and 148:
MERCURY 127 2. HEALTH EFFECTS occur
- Page 149 and 150:
MERCURY 129 2. HEALTH EFFECTS hypot
- Page 151 and 152:
MERCURY 131 2. HEALTH EFFECTS any e
- Page 153 and 154:
MERCURY 133 2. HEALTH EFFECTS in th
- Page 155 and 156:
MERCURY 135 2. HEALTH EFFECTS paral
- Page 157 and 158:
MERCURY 137 2. HEALTH EFFECTS as lo
- Page 159 and 160:
MERCURY 139 2. HEALTH EFFECTS Pregn
- Page 161 and 162:
MERCURY 141 2. HEALTH EFFECTS dysar
- Page 163 and 164:
MERCURY 143 2. HEALTH EFFECTS >12 p
- Page 165 and 166:
MERCURY 145 2. HEALTH EFFECTS Tempo
- Page 167 and 168:
MERCURY 147 2. HEALTH EFFECTS less
- Page 169 and 170:
MERCURY 149 2. HEALTH EFFECTS admin
- Page 171 and 172:
MERCURY 151 2. HEALTH EFFECTS Hg/kg
- Page 173 and 174:
MERCURY 153 2. HEALTH EFFECTS incre
- Page 175 and 176:
MERCURY 155 2. HEALTH EFFECTS is li
- Page 177 and 178:
MERCURY 157 2. HEALTH EFFECTS ulcer
- Page 179 and 180:
MERCURY 159 2. HEALTH EFFECTS patie
- Page 181 and 182:
MERCURY 161 2. HEALTH EFFECTS No st
- Page 183 and 184:
MERCURY 163 2.3.1.1 Inhalation Expo
- Page 185 and 186:
MERCURY 165 2. HEALTH EFFECTS was m
- Page 187 and 188:
MERCURY 167 2. HEALTH EFFECTS (1 mg
- Page 189 and 190:
MERCURY 169 2.3.1.3 Dermal Exposure
- Page 191 and 192:
MERCURY 171 2. HEALTH EFFECTS decli
- Page 193 and 194:
MERCURY 173 2. HEALTH EFFECTS prima
- Page 195 and 196:
MERCURY 175 2. HEALTH EFFECTS follo
- Page 197 and 198:
MERCURY 177 2. HEALTH EFFECTS methy
- Page 199 and 200:
MERCURY 179 2. HEALTH EFFECTS 1992;
- Page 201 and 202:
MERCURY 181 2. HEALTH EFFECTS side
- Page 203 and 204:
MERCURY 183 2. HEALTH EFFECTS pathw
- Page 205 and 206:
MERCURY 185 2.3.4 Elimination and E
- Page 208 and 209:
MERCURY 188 2. HEALTH EFFECTS worke
- Page 210:
MERCURY 190 2. HEALTH EFFECTS Rowla
- Page 213 and 214:
MERCURY 193 2. HEALTH EFFECTS 2.3.5
- Page 216:
MERCURY 196 2. HEALTH EFFECTS dosin
- Page 220 and 221:
MERCURY 200 2. HEALTH EFFECTS did o
- Page 226 and 227:
MERCURY 206 2. HEALTH EFFECTS reabs
- Page 228 and 229:
MERCURY 208 2. HEALTH EFFECTS Oral
- Page 230 and 231:
MERCURY 210 2. HEALTH EFFECTS Strai
- Page 232 and 233:
MERCURY 212 2. HEALTH EFFECTS enzym
- Page 234 and 235:
MERCURY 214 2. HEALTH EFFECTS Recen
- Page 236 and 237:
MERCURY 216 2. HEALTH EFFECTS 1995)
- Page 238 and 239:
MERCURY 218 2. HEALTH EFFECTS autoa
- Page 240 and 241:
MERCURY 220 2.5 RELEVANCE TO PUBLIC
- Page 242 and 243:
MERCURY 222 2. HEALTH EFFECTS Pheny
- Page 244 and 245:
MERCURY 224 2. HEALTH EFFECTS mercu
- Page 246 and 247:
MERCURY 226 2. HEALTH EFFECTS nonst
- Page 248 and 249:
MERCURY 228 2. HEALTH EFFECTS appre
- Page 250 and 251:
MERCURY 230 2. HEALTH EFFECTS the M
- Page 252 and 253:
MERCURY 232 2. HEALTH EFFECTS Emplo
- Page 254 and 255:
MERCURY 234 C 2. HEALTH EFFECTS and
- Page 256 and 257:
MERCURY 236 2. HEALTH EFFECTS Nakag
- Page 258 and 259:
MERCURY 238 2. HEALTH EFFECTS • (
- Page 260 and 261:
MERCURY 240 Supporting Studies 2. H
- Page 262 and 263:
MERCURY 242 2. HEALTH EFFECTS and e
- Page 264 and 265:
MERCURY 244 2. HEALTH EFFECTS the h
- Page 266 and 267:
MERCURY 246 2. HEALTH EFFECTS the m
- Page 268 and 269:
MERCURY 248 2. HEALTH EFFECTS Iraqi
- Page 271 and 272:
MERCURY 251 2. HEALTH EFFECTS al. (
- Page 273 and 274:
MERCURY 253 2. HEALTH EFFECTS The a
- Page 275 and 276:
MERCURY 255 2. HEALTH EFFECTS The N
- Page 277 and 278:
MERCURY 257 2. HEALTH EFFECTS NOAEL
- Page 279:
MERCURY 259 2. HEALTH EFFECTS where
- Page 282 and 283:
MERCURY 262 2. HEALTH EFFECTS they
- Page 284 and 285:
MERCURY 264 2. HEALTH EFFECTS Anima
- Page 286 and 287:
MERCURY 266 2. HEALTH EFFECTS acute
- Page 288 and 289:
MERCURY 268 2. HEALTH EFFECTS and d
- Page 290 and 291:
MERCURY 270 2. HEALTH EFFECTS Rowen
- Page 292 and 293:
MERCURY 272 2. HEALTH EFFECTS Tunne
- Page 294 and 295:
MERCURY 274 2. HEALTH EFFECTS 1992;
- Page 296 and 297:
MERCURY 276 2. HEALTH EFFECTS Neuro
- Page 298 and 299:
MERCURY 278 2. HEALTH EFFECTS serot
- Page 300 and 301:
MERCURY 280 2. HEALTH EFFECTS (0.06
- Page 302 and 303:
MERCURY 282 2. HEALTH EFFECTS Devel
- Page 304 and 305:
MERCURY 284 2. HEALTH EFFECTS The i
- Page 308 and 309:
MERCURY 288 2. HEALTH EFFECTS mercu
- Page 312 and 313:
MERCURY 292 2. HEALTH EFFECTS Cance
- Page 314 and 315:
MERCURY 294 2. HEALTH EFFECTS numbe
- Page 316 and 317:
MERCURY 296 2. HEALTH EFFECTS of in
- Page 318 and 319:
MERCURY 298 2. HEALTH EFFECTS Studi
- Page 320 and 321:
MERCURY 300 2. HEALTH EFFECTS or ot
- Page 322 and 323:
MERCURY 302 2. HEALTH EFFECTS Wheth
- Page 324 and 325:
MERCURY 304 2. HEALTH EFFECTS Acute
- Page 326 and 327:
MERCURY 306 2. HEALTH EFFECTS appar
- Page 328 and 329:
MERCURY 308 2. HEALTH EFFECTS most
- Page 330 and 331:
MERCURY 310 2. HEALTH EFFECTS Conce
- Page 332 and 333:
MERCURY 312 2. HEALTH EFFECTS The m
- Page 334 and 335:
MERCURY 314 2. HEALTH EFFECTS 5-10%
- Page 336 and 337:
MERCURY 316 2. HEALTH EFFECTS Japan
- Page 340 and 341:
MERCURY 320 2. HEALTH EFFECTS dysfu
- Page 342 and 343:
MERCURY 322 2. HEALTH EFFECTS mercu
- Page 344 and 345:
MERCURY 324 2. HEALTH EFFECTS selen
- Page 346 and 347:
MERCURY 326 2. HEALTH EFFECTS at do
- Page 348 and 349:
MERCURY 328 2. HEALTH EFFECTS Proba
- Page 350 and 351:
MERCURY 330 2. HEALTH EFFECTS parti
- Page 352 and 353:
MERCURY 332 2. HEALTH EFFECTS is me
- Page 354 and 355:
MERCURY 334 2. HEALTH EFFECTS 2.10.
- Page 360 and 361:
MERCURY 340 2. HEALTH EFFECTS Infor
- Page 362 and 363:
MERCURY 342 2. HEALTH EFFECTS Acute
- Page 364 and 365:
MERCURY 344 2. HEALTH EFFECTS chron
- Page 366 and 367:
MERCURY 346 2. HEALTH EFFECTS Repro
- Page 368 and 369:
MERCURY 348 2. HEALTH EFFECTS might
- Page 370 and 371:
MERCURY 350 2. HEALTH EFFECTS corre
- Page 372 and 373:
MERCURY 352 2. HEALTH EFFECTS In ge
- Page 374 and 375:
MERCURY 354 2. HEALTH EFFECTS initi
- Page 376 and 377:
MERCURY 356 2. HEALTH EFFECTS The m
- Page 383:
MERCURY 363 3.1 CHEMICAL IDENTITY 3
- Page 394 and 395:
MERCURY 374 4. PRODUCTION, IMPORT/E
- Page 396 and 397:
MERCURY 376 4. PRODUCTION, IMPORT/E
- Page 398 and 399:
MERCURY 378 4. PRODUCTION, IMPORT/E
- Page 400:
MERCURY 380 5. POTENTIAL FOR HUMAN
- Page 409 and 410: MERCURY 389 5. POTENTIAL FOR HUMAN
- Page 411: MERCURY 391 5. POTENTIAL FOR HUMAN
- Page 416: MERCURY 396 5.2.3 Soil 5. POTENTIAL
- Page 419 and 420: MERCURY 399 5. POTENTIAL FOR HUMAN
- Page 421: MERCURY 401 5. POTENTIAL FOR HUMAN
- Page 425 and 426: MERCURY 405 5. POTENTIAL FOR HUMAN
- Page 428 and 429: MERCURY 408 5. POTENTIAL FOR HUMAN
- Page 430 and 431: MERCURY 410 5. POTENTIAL FOR HUMAN
- Page 432 and 433: MERCURY 412 5. POTENTIAL FOR HUMAN
- Page 434 and 435: MERCURY 414 5. POTENTIAL FOR HUMAN
- Page 436 and 437: MERCURY 416 5. POTENTIAL FOR HUMAN
- Page 438 and 439: MERCURY 418 5. POTENTIAL FOR HUMAN
- Page 442: MERCURY 422 5. POTENTIAL FOR HUMAN
- Page 445: MERCURY 425 5. POTENTIAL FOR HUMAN
- Page 448 and 449: MERCURY 428 5. POTENTIAL FOR HUMAN
- Page 450 and 451: MERCURY 430 5. POTENTIAL FOR HUMAN
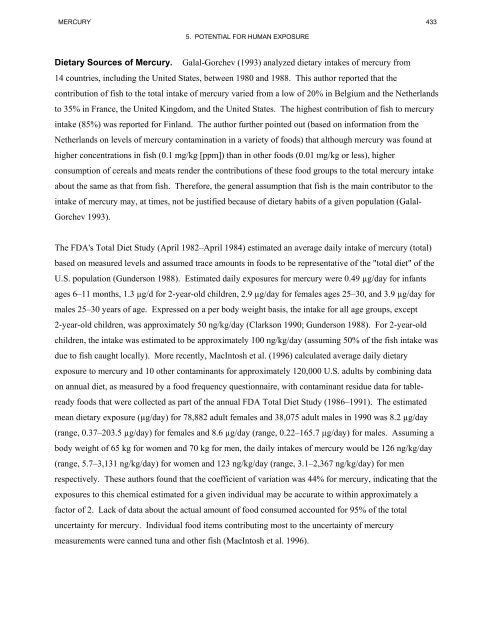
- Page 454: MERCURY 434 5. POTENTIAL FOR HUMAN
- Page 460: MERCURY 440 5. POTENTIAL FOR HUMAN
- Page 463: MERCURY 443 5. POTENTIAL FOR HUMAN
- Page 466: MERCURY 446 5. POTENTIAL FOR HUMAN
- Page 471 and 472: MERCURY 451 5. POTENTIAL FOR HUMAN
- Page 473 and 474: MERCURY 453 5. POTENTIAL FOR HUMAN
- Page 477 and 478: MERCURY 457 5. POTENTIAL FOR HUMAN
- Page 479 and 480: MERCURY 459 5. POTENTIAL FOR HUMAN
- Page 481 and 482: MERCURY 461 5. POTENTIAL FOR HUMAN
- Page 483 and 484: MERCURY 463 5. POTENTIAL FOR HUMAN
- Page 485 and 486: MERCURY 465 5. POTENTIAL FOR HUMAN
- Page 487 and 488: MERCURY 467 5. POTENTIAL FOR HUMAN
- Page 489: MERCURY 469 5. POTENTIAL FOR HUMAN
- Page 492 and 493: MERCURY 472 5. POTENTIAL FOR HUMAN
- Page 494 and 495: MERCURY 474 5. POTENTIAL FOR HUMAN
- Page 496 and 497: MERCURY 476 5.8 ADEQUACY OF THE DAT
- Page 498 and 499: MERCURY 478 5. POTENTIAL FOR HUMAN
- Page 500 and 501: MERCURY 480 5. POTENTIAL FOR HUMAN
- Page 502:
MERCURY 482 5.8.2 Ongoing Studies 5
- Page 508:
MERCURY 488 6. ANALYTICAL METHODS i
- Page 513 and 514:
MERCURY 493 6. ANALYTICAL METHODS a
- Page 515:
MERCURY 495 6.2 ENVIRONMENTAL SAMPL
- Page 524 and 525:
MERCURY 504 6. ANALYTICAL METHODS N
- Page 526:
MERCURY 506 6. ANALYTICAL METHODS n
- Page 530 and 531:
MERCURY 510 7. REGULATIONS AND ADVI
- Page 532 and 533:
MERCURY 512 7. REGULATIONS AND ADVI
- Page 534:
MERCURY 514 7. REGULATIONS AND ADVI
- Page 546 and 547:
MERCURY 526 8. REFERENCES *Airey D.
- Page 548 and 549:
MERCURY 528 8. REFERENCES *Anttila
- Page 550 and 551:
MERCURY 530 8. REFERENCES *Bagedahl
- Page 552 and 553:
MERCURY 532 8. REFERENCES *Becker P
- Page 554 and 555:
MERCURY 534 8. REFERENCES *Bichler
- Page 556 and 557:
MERCURY 536 8. REFERENCES *Bowman C
- Page 558 and 559:
MERCURY 538 8. REFERENCES *Campbell
- Page 560 and 561:
MERCURY 540 8. REFERENCES *Chang LW
- Page 562 and 563:
MERCURY 542 8. REFERENCES *Clarkson
- Page 564 and 565:
MERCURY 544 8. REFERENCES *Crump KS
- Page 566 and 567:
MERCURY 546 8. REFERENCES *DOE. 199
- Page 568 and 569:
MERCURY 548 8. REFERENCES *Ellingse
- Page 570 and 571:
MERCURY 550 8. REFERENCES EPA. 1987
- Page 572 and 573:
MERCURY 552 8. REFERENCES *EPA. 199
- Page 574 and 575:
MERCURY 554 8. REFERENCES FDA. 1982
- Page 576 and 577:
MERCURY 556 8. REFERENCES *FSTRAC.
- Page 578 and 579:
MERCURY 558 8. REFERENCES *Gill GA,
- Page 580 and 581:
MERCURY 560 8. REFERENCES *Grandjea
- Page 582 and 583:
MERCURY 562 8. REFERENCES *Harada H
- Page 584 and 585:
MERCURY 564 8. REFERENCES *Hueter R
- Page 586 and 587:
MERCURY 566 8. REFERENCES Iverfeldt
- Page 588 and 589:
MERCURY 568 8. REFERENCES *Kanluen
- Page 590 and 591:
MERCURY 570 8. REFERENCES *Kuntz WD
- Page 592 and 593:
MERCURY 572 8. REFERENCES *Leroux B
- Page 594 and 595:
MERCURY 574 8. REFERENCES Livardjan
- Page 596 and 597:
MERCURY 576 8. REFERENCES *Malt UF,
- Page 598 and 599:
MERCURY 578 8. REFERENCES *Merck. 1
- Page 600 and 601:
MERCURY 580 8. REFERENCES *Morselli
- Page 602 and 603:
MERCURY 582 8. REFERENCES *Newland
- Page 604 and 605:
MERCURY 584 8. REFERENCES *Nordberg
- Page 606 and 607:
MERCURY 586 8. REFERENCES *Osol A,
- Page 608 and 609:
MERCURY 588 8. REFERENCES Pilgrim W
- Page 610 and 611:
MERCURY 590 8. REFERENCES *Regnell
- Page 612 and 613:
MERCURY 592 8. REFERENCES *Rosenman
- Page 614 and 615:
MERCURY 594 8. REFERENCES *Sato K,
- Page 616 and 617:
MERCURY 596 8. REFERENCES *Shkinev
- Page 618 and 619:
MERCURY 598 8. REFERENCES *Soria ML
- Page 620 and 621:
MERCURY 600 8. REFERENCES *Syversen
- Page 622 and 623:
MERCURY 602 8. REFERENCES *Tsuzuki
- Page 624 and 625:
MERCURY 604 8. REFERENCES *Vieira I
- Page 626 and 627:
MERCURY 606 8. REFERENCES *Wendroff
- Page 628 and 629:
MERCURY 608 8. REFERENCES *Wulf HC,
- Page 630 and 631:
MERCURY 610 8. REFERENCES *Zanoli P
- Page 632 and 633:
MERCURY 612 9. GLOSSARY Case Series
- Page 634 and 635:
MERCURY 614 9. GLOSSARY Morbidity
- Page 636 and 637:
MERCURY 616 9. GLOSSARY Reproductiv
- Page 639 and 640:
MERCURY A-1 APPENDIX A ATSDR MINIMA
- Page 641 and 642:
MERCURY A-3 APPENDIX A MINIMAL RISK
- Page 643 and 644:
MERCURY A-5 APPENDIX A low-dose chr
- Page 645 and 646:
MERCURY A-7 APPENDIX A Was a conver
- Page 647 and 648:
MERCURY A-9 APPENDIX A If so, expla
- Page 649 and 650:
MERCURY A-11 APPENDIX A exposure fr
- Page 651 and 652:
MERCURY A-13 APPENDIX A during the
- Page 653 and 654:
MERCURY A-15 APPENDIX A Using the a
- Page 655 and 656:
MERCURY A-17 APPENDIX A Scales of I
- Page 657 and 658:
MERCURY A-19 APPENDIX A methylmercu
- Page 659 and 660:
MERCURY A-21 APPENDIX A concern in
- Page 661 and 662:
MERCURY A-23 Alternative Derivation
- Page 663 and 664:
MERCURY B-1 Chapter 1 Public Health
- Page 665 and 666:
MERCURY B-3 APPENDIX B (11) CEL A C
- Page 668 and 669:
MERCURY B-6 Chapter 2 (Section 2.5)
- Page 671 and 672:
MERCURY C-1 APPENDIX C ACRONYMS, AB
- Page 673 and 674:
MERCURY C-3 APPENDIX C MCLG Maximum
- Page 675:
MERCURY C-5 < less than < less than


