You also want an ePaper? Increase the reach of your titles
YUMPU automatically turns print PDFs into web optimized ePapers that Google loves.
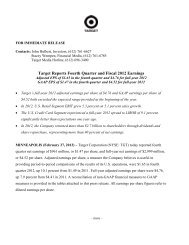
Ventes de marchandises HT<br />
(en millions d’euros)<br />
A périmètre constant (hors Italie),<br />
l’activité progresse de 3,4 %.<br />
Evolution des résultats<br />
(en millions d’euros)<br />
Le résultat net courant, c’est-à-dire hors<br />
exceptionnel, ressort en <strong>2003</strong> à 14,5 millions<br />
d’euros, en hausse de + 55 %.<br />
Performances (en millions d’euros)<br />
France 2002 <strong>2003</strong><br />
Chiffre d'affaires 869,7 888,8<br />
Résultat d'exploitation 25,6 23,7<br />
Résultat net 14,6 33,2<br />
Capacité d'autofinancement 28,5 26,4<br />
Roumanie 2002 <strong>2003</strong><br />
Chiffre d'affaires 41,6 53,7<br />
Résultat d'exploitation (1,4) (0,1)<br />
Résultat net (1,9) (1,0)<br />
Capacité d'autofinancement (0,9) 1,2<br />
(1) Roumanie intégrée à 50 %<br />
Italie 2002 <strong>2003</strong><br />
Chiffre d'affaires 99,0 -<br />
Résultat d'exploitation (2,1) -<br />
Résultat net 2,0 -<br />
Capacité d'autofinancement 0,9 -<br />
1 100,0<br />
1 000,0<br />
900,0<br />
800,0<br />
700,0<br />
600,0<br />
500,0<br />
400,0<br />
120<br />
70<br />
20<br />
- 30<br />
- 80<br />
1999 2000 2001 2002 <strong>2003</strong><br />
35<br />
30<br />
25<br />
20<br />
15<br />
10<br />
+ 12,0 %<br />
806,0<br />
5<br />
0<br />
1,80<br />
1,60<br />
1,40<br />
1,20<br />
1,00<br />
0,80<br />
0,60<br />
0,40<br />
0,20<br />
0,00<br />
18,9<br />
8,2<br />
902,5<br />
21,3<br />
+ 7,3 %<br />
1999 2000<br />
0,32<br />
4,7<br />
1999 2000<br />
968,2<br />
15,3<br />
+ 4,3 % 1 010,3 - 6,70 % 942,5<br />
9,5<br />
22,1<br />
14,7<br />
2001 2002 <strong>2003</strong><br />
Résultat d'exploitation Résultat net<br />
0,20<br />
0,30<br />
0,54<br />
23,6<br />
Un double dividende en <strong>2003</strong> (en euros)<br />
Le dividende de 0,80 euro par action correspond<br />
à un taux de distribution de 44 %.<br />
Il est complété par un dividende supplémentaire<br />
au titre du désengagement de l’Italie.<br />
1,00<br />
32,2<br />
0,80<br />
2001 2002 <strong>2003</strong><br />
Dividende par action (en euros) Dividende supplémentaire<br />
Structure financière (en millions d’euros)<br />
66,1<br />
1999<br />
23,8<br />
67,1<br />
56,0<br />
75,1<br />
49,2<br />
87,7<br />
39,5<br />
115,5<br />
Capitaux propres Dettes financières nettes<br />
- 41,6<br />
2000 2001 2002 <strong>2003</strong><br />
Année 1999 2000 2001 2002 <strong>2003</strong><br />
Taux d'endettement (DF/FP) 36 % 83 % 66 % 45 % - 36%