Integriertes Klimaschutzkonzept Lahr 2012 - Endbericht - Stadt Lahr
Integriertes Klimaschutzkonzept Lahr 2012 - Endbericht - Stadt Lahr
Integriertes Klimaschutzkonzept Lahr 2012 - Endbericht - Stadt Lahr

Sie wollen auch ein ePaper? Erhöhen Sie die Reichweite Ihrer Titel.
YUMPU macht aus Druck-PDFs automatisch weboptimierte ePaper, die Google liebt.
50 Trendszenario<br />
<strong>Integriertes</strong> <strong>Klimaschutzkonzept</strong> <strong>Lahr</strong> <strong>2012</strong><br />
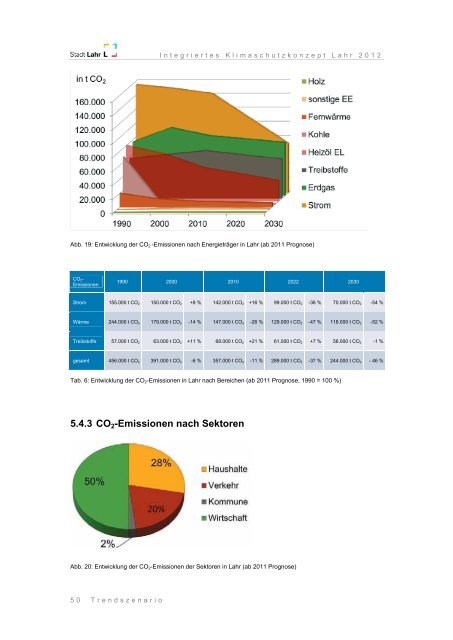
Abb. 19: Entwicklung der CO2 -Emissionen nach Energieträger in <strong>Lahr</strong> (ab 2011 Prognose)<br />
CO 2-<br />
Emissionen<br />
1990 2000 2010 2022 2030<br />
Strom 155.000 t CO 2 150.000 t CO 2 +8 % 142.000 t CO 2 +16 % 99.000 t CO 2 -36 % 70.000 t CO 2 -54 %<br />
Wärme 244.000 t CO 2 179.000 t CO 2 -14 % 147.000 t CO 2 -26 % 129.000 t CO 2 -47 % 118.000 t CO 2 -52 %<br />
Treibstoffe 57.000 t CO 2 63.000 t CO 2 +11 % 68.000 t CO 2 +21 % 61.000 t CO 2 +7 % 56.000 t CO 2 -1 %<br />
gesamt 456.000 t CO 2 391.000 t CO 2 -6 % 357.000 t CO 2 -11 % 289.000 t CO 2 -37 % 244.000 t CO 2 - 46 %<br />
Tab. 6: Entwicklung der CO2-Emissionen in <strong>Lahr</strong> nach Bereichen (ab 2011 Prognose, 1990 = 100 %)<br />
5.4.3 CO2-Emissionen nach Sektoren<br />
Abb. 20: Entwicklung der CO2-Emissionen der Sektoren in <strong>Lahr</strong> (ab 2011 Prognose)