Properties of hemp fibre polymer composites -An optimisation of ...
Properties of hemp fibre polymer composites -An optimisation of ...
Properties of hemp fibre polymer composites -An optimisation of ...

You also want an ePaper? Increase the reach of your titles
YUMPU automatically turns print PDFs into web optimized ePapers that Google loves.
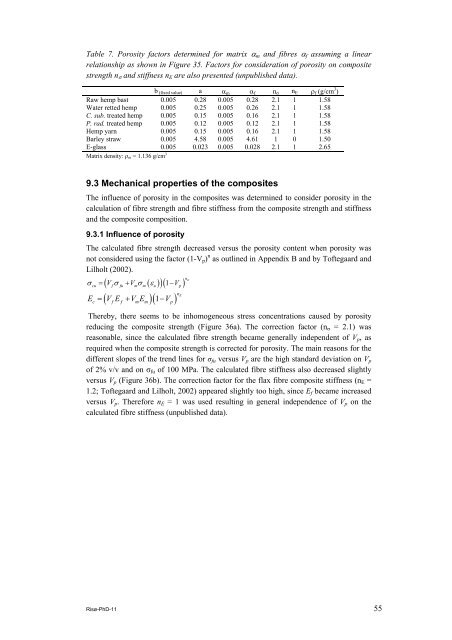
Table 7. Porosity factors determined for matrix αm and <strong>fibre</strong>s αf assuming a linear<br />
relationship as shown in Figure 35. Factors for consideration <strong>of</strong> porosity on composite<br />
strength nσ and stiffness nE are also presented (unpublished data).<br />
b (fixed value) a α m α f n σ n E ρf (g/cm 3 )<br />
Raw <strong>hemp</strong> bast 0.005 0.28 0.005 0.28 2.1 1 1.58<br />
Water retted <strong>hemp</strong> 0.005 0.25 0.005 0.26 2.1 1 1.58<br />
C. sub. treated <strong>hemp</strong> 0.005 0.15 0.005 0.16 2.1 1 1.58<br />
P. rad. treated <strong>hemp</strong> 0.005 0.12 0.005 0.12 2.1 1 1.58<br />
Hemp yarn 0.005 0.15 0.005 0.16 2.1 1 1.58<br />
Barley straw 0.005 4.58 0.005 4.61 1 0 1.50<br />
E-glass 0.005 0.023 0.005 0.028 2.1 1 2.65<br />
Matrix density: ρm = 1.136 g/cm 3<br />
9.3 Mechanical properties <strong>of</strong> the <strong>composites</strong><br />
The influence <strong>of</strong> porosity in the <strong>composites</strong> was determined to consider porosity in the<br />
calculation <strong>of</strong> <strong>fibre</strong> strength and <strong>fibre</strong> stiffness from the composite strength and stiffness<br />
and the composite composition.<br />
9.3.1 Influence <strong>of</strong> porosity<br />
The calculated <strong>fibre</strong> strength decreased versus the porosity content when porosity was<br />
not considered using the factor (1-Vp) n as outlined in Appendix B and by T<strong>of</strong>tegaard and<br />
Lilholt (2002).<br />
( ( ) )( 1 )<br />
V V V σ<br />
σ = σ + σ ε −<br />
cu f fu m m u p<br />
n<br />
c = f f + m m − p<br />
( )(1 ) E<br />
E V E V E V<br />
n<br />
Thereby, there seems to be inhomogeneous stress concentrations caused by porosity<br />
reducing the composite strength (Figure 36a). The correction factor (nσ = 2.1) was<br />
reasonable, since the calculated <strong>fibre</strong> strength became generally independent <strong>of</strong> Vp, as<br />
required when the composite strength is corrected for porosity. The main reasons for the<br />
different slopes <strong>of</strong> the trend lines for σfu versus Vp are the high standard deviation on Vp<br />
<strong>of</strong> 2% v/v and on σfu <strong>of</strong> 100 MPa. The calculated <strong>fibre</strong> stiffness also decreased slightly<br />
versus Vp (Figure 36b). The correction factor for the flax <strong>fibre</strong> composite stiffness (nE =<br />
1.2; T<strong>of</strong>tegaard and Lilholt, 2002) appeared slightly too high, since Ef became increased<br />
versus Vp. Therefore nE = 1 was used resulting in general independence <strong>of</strong> Vp on the<br />
calculated <strong>fibre</strong> stiffness (unpublished data).<br />
Risø-PhD-11 55