Properties of hemp fibre polymer composites -An optimisation of ...
Properties of hemp fibre polymer composites -An optimisation of ...
Properties of hemp fibre polymer composites -An optimisation of ...

You also want an ePaper? Increase the reach of your titles
YUMPU automatically turns print PDFs into web optimized ePapers that Google loves.
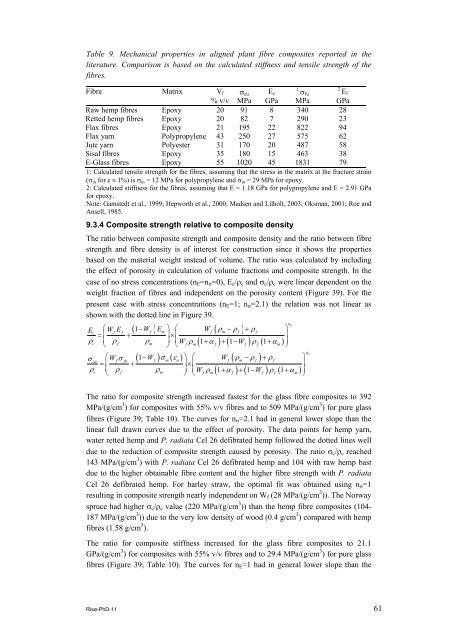
Table 9. Mechanical properties in aligned plant <strong>fibre</strong> <strong>composites</strong> reported in the<br />
literature. Comparison is based on the calculated stiffness and tensile strength <strong>of</strong> the<br />
<strong>fibre</strong>s.<br />
Fibre Matrix Vf<br />
% v/v<br />
σcu<br />
MPa<br />
Ec<br />
GPa<br />
1<br />
σfu<br />
MPa GPa<br />
Raw <strong>hemp</strong> <strong>fibre</strong>s Epoxy 20 91 8 340 28<br />
Retted <strong>hemp</strong> <strong>fibre</strong>s Epoxy 20 82 7 290 23<br />
Flax <strong>fibre</strong>s Epoxy 21 195 22 822 94<br />
Flax yarn Polypropylene 43 250 27 575 62<br />
Jute yarn Polyester 31 170 20 487 58<br />
Sisal <strong>fibre</strong>s Epoxy 35 180 15 463 38<br />
E-Glass <strong>fibre</strong>s Epoxy 55 1020 45 1831 79<br />
1: Calculated tensile strength for the <strong>fibre</strong>s, assuming that the stress in the matrix at the fracture strain<br />
(σ m for ε ≈ 1%) is σ m = 12 MPa for polypropylene and σm<br />
= 29 MPa for epoxy.<br />
2: Calculated stiffness for the <strong>fibre</strong>s, assuming that E = 1.18 GPa for polypropylene and E = 2.91 GPa<br />
for epoxy.<br />
Note: Gamstedt et al., 1999; Hepworth et al., 2000; Madsen and Lilholt, 2003; Oksman, 2001; Roe and<br />
<strong>An</strong>sell, 1985.<br />
9.3.4 Composite strength relative to composite density<br />
The ratio between composite strength and composite density and the ratio between <strong>fibre</strong><br />
strength and <strong>fibre</strong> density is <strong>of</strong> interest for construction since it shows the properties<br />
based on the material weight instead <strong>of</strong> volume. The ratio was calculated by including<br />
the effect <strong>of</strong> porosity in calculation <strong>of</strong> volume fractions and composite strength. In the<br />
case <strong>of</strong> no stress concentrations (nE=nσ=0), Ec/ρc and σc/ρc were linear dependent on the<br />
weight fraction <strong>of</strong> <strong>fibre</strong>s and independent on the porosity content (Figure 39). For the<br />
present case with stress concentrations (nE=1; nσ=2.1) the relation was not linear as<br />
shown with the dotted line in Figure 39.<br />
nE<br />
E ⎛WE ( 1−Wf<br />
) E ⎞ ⎛ m Wf<br />
( ρm − ρ f f<br />
f ) + ρ ⎞<br />
c<br />
f<br />
= ⎜ + ⎟× ⎜<br />
⎟<br />
ρ ⎜ c ρf ρ ⎟ ⎜<br />
⎝ m ⎠ ⎝<br />
Wfρm( 1+ α f ) + ( 1− Wf<br />
) ρ f ( 1+<br />
αm)<br />
⎟<br />
⎠<br />
( 1−Wf<br />
) σm( εu) Wf<br />
( ρm − ρ f ) + ρf<br />
W ( 1 ) ( 1 W ) ( 1 )<br />
σ ⎛W cu fσ ⎞ ⎛<br />
⎞<br />
fu<br />
= ⎜ + ⎟× ⎜<br />
⎟<br />
ρ ⎜ c ρ f ρ ⎟ ⎜<br />
⎝ m ⎠ ⎝ fρm + α f + − f ρ f + α ⎟<br />
m ⎠<br />
The ratio for composite strength increased fastest for the glass <strong>fibre</strong> <strong>composites</strong> to 392<br />
MPa/(g/cm 3 ) for <strong>composites</strong> with 55% v/v <strong>fibre</strong>s and to 509 MPa/(g/cm 3 ) for pure glass<br />
<strong>fibre</strong>s (Figure 39; Table 10). The curves for nσ=2.1 had in general lower slope than the<br />
linear full drawn curves due to the effect <strong>of</strong> porosity. The data points for <strong>hemp</strong> yarn,<br />
water retted <strong>hemp</strong> and P. radiata Cel 26 defibrated <strong>hemp</strong> followed the dotted lines well<br />
due to the reduction <strong>of</strong> composite strength caused by porosity. The ratio σc/ρc reached<br />
143 MPa/(g/cm 3 ) with P. radiata Cel 26 defibrated <strong>hemp</strong> and 104 with raw <strong>hemp</strong> bast<br />
due to the higher obtainable <strong>fibre</strong> content and the higher <strong>fibre</strong> strength with P. radiata<br />
Cel 26 defibrated <strong>hemp</strong>. For barley straw, the optimal fit was obtained using nσ=1<br />
resulting in composite strength nearly independent on Wf (28 MPa/(g/cm 3 )). The Norway<br />
spruce had higher σc/ρc value (220 MPa/(g/cm 3 )) than the <strong>hemp</strong> <strong>fibre</strong> <strong>composites</strong> (104-<br />
187 MPa/(g/cm 3 )) due to the very low density <strong>of</strong> wood (0.4 g/cm 3 ) compared with <strong>hemp</strong><br />
<strong>fibre</strong>s (1.58 g/cm 3 ).<br />
The ratio for composite stiffness increased for the glass <strong>fibre</strong> <strong>composites</strong> to 21.1<br />
GPa/(g/cm 3 ) for <strong>composites</strong> with 55% v/v <strong>fibre</strong>s and to 29.4 MPa/(g/cm 3 ) for pure glass<br />
<strong>fibre</strong>s (Figure 39; Table 10). The curves for nE=1 had in general lower slope than the<br />
Risø-PhD-11 61<br />
nσ<br />
2 Ef