NUI Galway – UL Alliance First Annual ENGINEERING AND - ARAN ...
NUI Galway – UL Alliance First Annual ENGINEERING AND - ARAN ...
NUI Galway – UL Alliance First Annual ENGINEERING AND - ARAN ...

You also want an ePaper? Increase the reach of your titles
YUMPU automatically turns print PDFs into web optimized ePapers that Google loves.
A Long-term Study of the Setting Reaction of Glass Ionomer Cements by IR<br />
C. M. Crowley a , T. Pembroke b , S. Hampshire a ,<br />
a Department of Materials Science and Technology, University of Limerick, Ireland<br />
b Department of Chemical and Environmental Sciences, University of Limerick, Ireland<br />
Clare.Crowley@ul.ie<br />
Abstract<br />
Changes in the positions and intensities of carboxylate<br />
stretching modes during the setting reaction of dental<br />
restorative experimental glass ionomer cements (GICs)<br />
have been monitored by FTIR.<br />
Introduction<br />
Numerous approaches have attempted to characterise<br />
the changes that occur in the cement matrix of GICs<br />
during setting including FTIR [1], Raman [2] and<br />
MAS-NMR ( 13 C NMR [3] and 27 Al MAS-NMR [4, 5]).<br />
This has resulted in alternative hypotheses having been<br />
proposed to account for the long-term changes observed<br />
in the mechanical properties but the mechanism of these<br />
changes is not fully understood [4]. In this study,<br />
changes in the carboxylate stretching modes during the<br />
setting reaction have been monitored by FTIR.<br />
Materials and Methods<br />
Glass compositions<br />
The frits of the glass compositions (Table 1) were<br />
attrition milled to produce powders with a d50 of<br />
approximately 5 µm.<br />
Table 1: Pre-firing constituent molar ratios of the<br />
experimental glasses<br />
Glass<br />
Molar Ratios<br />
SiO2 Al2O3 P2O CaF2 SrO SrF2 LG125 4.5 3 1.5 2 3 -<br />
LG26 Sr 4.5 3 1.5 - 3 2<br />
ART10 4.5 3 0.75 - 3 2<br />
Cement Design<br />
The cements were mixed at powder (glass +<br />
poly(acrylic acid) (PAA200) (Mw = 210,300; Mn =<br />
111,300):water ratio of 3:1. The glass:PAA ratio was<br />
varied so that the charge g -1 of the glass in the cements<br />
was constant. At various times after mixing the<br />
samples were immersed in nitrogen (l), frozen (- 20 °C,<br />
>24 hrs), freeze-dried (-60 °C, > 1 atm, 3 days),<br />
gyromilled and sieved < 45 µm.<br />
FTIR measurements<br />
ATR-FTIR spectra (Perkin Elmer Spectrum 100; zinc<br />
selenide crystal) of the cements (< 45 m) were<br />
collected between 4000 <strong>–</strong> 600 cm -1 (resolution = 1 cm -1 ,<br />
number of scans = 50). Background spectra were<br />
subtracted from the sample spectra, which were<br />
normalised using 1800 cm -1 as the zero point.<br />
5<br />
174<br />
Deconvolution of the spectra was performed using a<br />
Gaussian model (Peak Fit (Version 4)).<br />
Results<br />
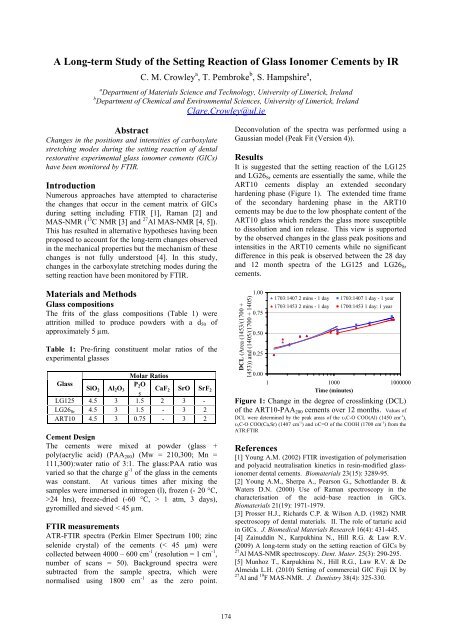
It is suggested that the setting reaction of the LG125<br />
and LG26Sr cements are essentially the same, while the<br />
ART10 cements display an extended secondary<br />
hardening phase (Figure 1). The extended time frame<br />
of the secondary hardening phase in the ART10<br />
cements may be due to the low phosphate content of the<br />
ART10 glass which renders the glass more susceptible<br />
to dissolution and ion release. This view is supported<br />
by the observed changes in the glass peak positions and<br />
intensities in the ART10 cements while no significant<br />
difference in this peak is observed between the 28 day<br />
and 12 month spectra of the LG125 and LG26Sr<br />
cements.<br />
DCL (Area (1453/(1700 +<br />
1453)) and (1405/(1700 + 1405)<br />
1.00<br />
0.75<br />
0.50<br />
0.25<br />
0.00<br />
1703:1407 2 mins - 1 day 1703:1407 1 day - 1 year<br />
1703:1453 2 mins - 1 day 1700:1453 1 day: 1 year<br />
1 1000 1000000<br />
Time (minutes)<br />
Figure 1: Change in the degree of crosslinking (DCL)<br />
of the ART10-PAA200 cements over 12 months. Values of<br />
DCL were determined by the peak areas of the sC-O COO(Al) (1450 cm -1 ),<br />
sC-O COO(Ca,Sr) (1407 cm -1 ) and C=O of the COOH (1700 cm -1 ) from the<br />
ATR:FTIR<br />
References<br />
[1] Young A.M. (2002) FTIR investigation of polymerisation<br />
and polyacid neutralisation kinetics in resin-modified glassionomer<br />
dental cements. Biomaterials 23(15): 3289-95.<br />
[2] Young A.M., Sherpa A., Pearson G., Schottlander B. &<br />
Waters D.N. (2000) Use of Raman spectroscopy in the<br />
characterisation of the acid<strong>–</strong>base reaction in GICs.<br />
Biomaterials 21(19): 1971-1979.<br />
[3] Prosser H.J., Richards C.P. & Wilson A.D. (1982) NMR<br />
spectroscopy of dental materials. II. The role of tartaric acid<br />
in GICs. J. Biomedical Materials Research 16(4): 431-445.<br />
[4] Zainuddin N., Karpukhina N., Hill R.G. & Law R.V.<br />
(2009) A long-term study on the setting reaction of GICs by<br />
27 Al MAS-NMR spectroscopy. Dent. Mater. 25(3): 290-295.<br />
[5] Munhoz T., Karpukhina N., Hill R.G., Law R.V. & De<br />
Almeida L.H. (2010) Setting of commercial GIC Fuji IX by<br />
27 Al and 19 F MAS-NMR. J. Dentistry 38(4): 325-330.