NUI Galway – UL Alliance First Annual ENGINEERING AND - ARAN ...
NUI Galway – UL Alliance First Annual ENGINEERING AND - ARAN ...
NUI Galway – UL Alliance First Annual ENGINEERING AND - ARAN ...

You also want an ePaper? Increase the reach of your titles
YUMPU automatically turns print PDFs into web optimized ePapers that Google loves.
Abstract<br />
University Rankings are a tool used to compare<br />
universities based on a number of criteria deemed to be<br />
common to all universities. A university’s rank has been<br />
shown to influence admission numbers for that<br />
university [1] and so universities actively compete to<br />
better their positions in rankings. Visualisation refers to<br />
presenting raw data in visual form. Visualisation of<br />
data makes information clearer and more accessible.<br />
This research proposes to investigate the different<br />
ranking systems and their current flaws as well as<br />
different visualization techniques suitable for<br />
representing university rankings. A treemap<br />
visualization will be implemented showing a<br />
university’s ranking over time.<br />
1. Introduction<br />
World university rankings began in 2003 with the<br />
publication of the Academic Ranking of World<br />
Universities (ARWU) by the Shanghai Jiao Tong<br />
University. Initially the purpose of this publication was<br />
to measure the differences between Chinese and World<br />
class universities. The rankings attracted attention<br />
worldwide and have been cited in The Economist<br />
magazine. Today it is one of the most influential<br />
rankings, along with the QS World University Rankings<br />
and Times Higher Education World University<br />
Rankings. University rankings also exist at a national<br />
level. For example “The Sunday Times” ranks<br />
universities in Ireland.<br />
2. Methodologies<br />
THE and QS World University Rankings were not<br />
always separate and used to be called THE-QS World<br />
University Rankings. The two split in 2010 with THE<br />
adopting a new methodology. Both use an academic<br />
reputation survey which gathers the opinions of<br />
academics on universities. This criterion has a high<br />
weighting in both and is subject to much criticism.<br />
ARWU give the highest weightings to the criteria<br />
„quality of staff‟ and „research output‟.<br />
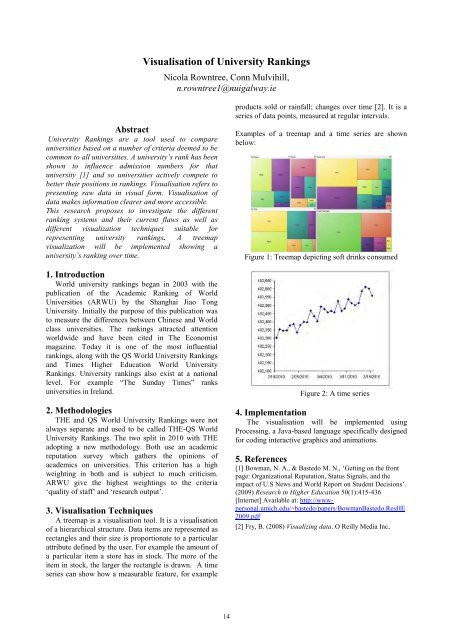
3. Visualisation Techniques<br />
A treemap is a visualisation tool. It is a visualisation<br />
of a hierarchical structure. Data items are represented as<br />
rectangles and their size is proportionate to a particular<br />
attribute defined by the user. For example the amount of<br />
a particular item a store has in stock. The more of the<br />
item in stock, the larger the rectangle is drawn. A time<br />
series can show how a measurable feature, for example<br />
Visualisation of University Rankings<br />
Nicola Rowntree, Conn Mulvihill,<br />
n.rowntree1@nuigalway.ie<br />
14<br />
products sold or rainfall; changes over time [2]. It is a<br />
series of data points, measured at regular intervals.<br />
Examples of a treemap and a time series are shown<br />
below:<br />
Figure 1: Treemap depicting soft drinks consumed<br />
Figure 2: A time series<br />
4. Implementation<br />
The visualisation will be implemented using<br />
Processing, a Java-based language specifically designed<br />
for coding interactive graphics and animations.<br />
5. References<br />
[1] Bowman, N. A., & Bastedo M. N., „Getting on the front<br />
page: Organizational Reputation, Status Signals, and the<br />
impact of U.S News and World Report on Student Decisions‟.<br />
(2009) Research in Higher Education 50(1):415-436<br />
[Internet] Available at: http://wwwpersonal.umich.edu/~bastedo/papers/BowmanBastedo.ResHE<br />
2009.pdf<br />
[2] Fry, B. (2008) Visualizing data. O Reilly Media Inc.