NUI Galway – UL Alliance First Annual ENGINEERING AND - ARAN ...
NUI Galway – UL Alliance First Annual ENGINEERING AND - ARAN ...
NUI Galway – UL Alliance First Annual ENGINEERING AND - ARAN ...

Create successful ePaper yourself
Turn your PDF publications into a flip-book with our unique Google optimized e-Paper software.
Image Recognition and Classification of tuberculosis Bacilli.<br />
Abstract<br />
In this project we present a new method for identifying<br />
tuberculosis in microscopic images of sputum. The<br />
problem with automatic identification is that in an<br />
image there are many other objects that are not the<br />
bacillus. In order to be able to correctly identify the<br />
objects we use a method called shape profile that<br />
creates a profile based on the distance from the centre<br />
of an object to its border. The bacilli shapes have a<br />
similar profile to each other but are different enough to<br />
other objects to distinguish between them. We then use<br />
dynamic time warping to perform nearest-neighbour<br />
classification on the objects.<br />
1. Introduction<br />
Tuberculosis detection is done by obtaining a sputum<br />
sample from a patient and examining it under a<br />
microscope for bacilli.<br />
The problem with manual bacilli detection is that it is<br />
a very tedious task which requires skilled personal<br />
resources and can lead to low sensitivity. Depending on<br />
their angle and the position of the bacilli there can be<br />
much dispute about what a bacillus is as the shape of<br />
the bacillus can vary greatly from cane shapes Figure<br />
1(a) and concave Figure 1(b). Sometimes even doctors<br />
will dispute what a bacillus is.<br />
Image detection has taken many forms before the<br />
most obvious tell tale of any bacillus is its bright<br />
florescent color which has been used before to identify<br />
them [1].The profile method we are using has been used<br />
to identify tumors in cancer tissue [2] and predict the<br />
models of cars by measuring and comparing the profiles<br />
of objects found in images [4].<br />
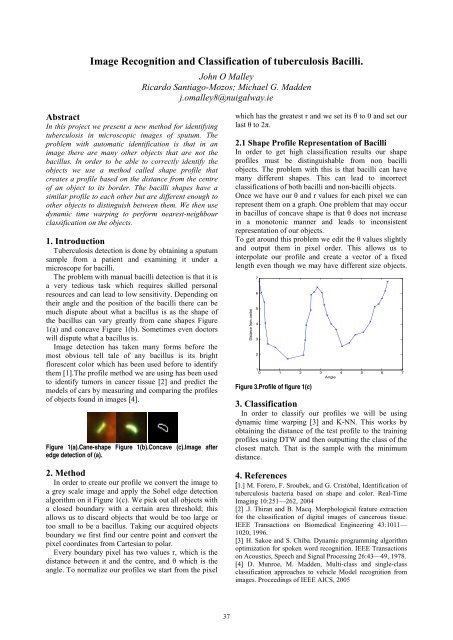
Figure 1(a).Cane-shape Figure 1(b).Concave (c).Image after<br />
edge detection of (a).<br />
2. Method<br />
In order to create our profile we convert the image to<br />
a grey scale image and apply the Sobel edge detection<br />
algorithm on it Figure 1(c). We pick out all objects with<br />
a closed boundary with a certain area threshold; this<br />
allows us to discard objects that would be too large or<br />
too small to be a bacillus. Taking our acquired objects<br />
boundary we first find our centre point and convert the<br />
pixel coordinates from Cartesian to polar.<br />
Every boundary pixel has two values r, which is the<br />
distance between it and the centre, and θ which is the<br />
angle. To normalize our profiles we start from the pixel<br />
John O Malley<br />
Ricardo Santiago-Mozos; Michael G. Madden<br />
j.omalley8@nuigalway.ie<br />
37<br />
which has the greatest r and we set its θ to 0 and set our<br />
last θ to 2π.<br />
2.1 Shape Profile Representation of Bacilli<br />
In order to get high classification results our shape<br />
profiles must be distinguishable from non bacilli<br />
objects. The problem with this is that bacilli can have<br />
many different shapes. This can lead to incorrect<br />
classifications of both bacilli and non-bacilli objects.<br />
Once we have our θ and r values for each pixel we can<br />
represent them on a graph. One problem that may occur<br />
in bacillus of concave shape is that θ does not increase<br />
in a monotonic manner and leads to inconsistent<br />
representation of our objects.<br />
To get around this problem we edit the θ values slightly<br />
and output them in pixel order. This allows us to<br />
interpolate our profile and create a vector of a fixed<br />
length even though we may have different size objects.<br />
Distance from centre<br />
7<br />
6<br />
5<br />
4<br />
3<br />
2<br />
1<br />
0 1 2 3 4 5 6 7<br />
Angle<br />
Figure 3.Profile of figure 1(c)<br />
3. Classification<br />
In order to classify our profiles we will be using<br />
dynamic time warping [3] and K-NN. This works by<br />
obtaining the distance of the test profile to the training<br />
profiles using DTW and then outputting the class of the<br />
closest match. That is the sample with the minimum<br />
distance.<br />
4. References<br />
[1.] M. Forero, F. Sroubek, and G. Cristóbal, Identification of<br />
tuberculosis bacteria based on shape and color. Real-Time<br />
Imaging 10:251—262, 2004<br />
[2] .J. Thiran and B. Macq. Morphological feature extraction<br />
for the classification of digital images of cancerous tissue.<br />
IEEE Transactions on Biomedical Engineering 43:1011—<br />
1020, 1996.<br />
[3] H. Sakoe and S. Chiba. Dynamic programming algorithm<br />
optimization for spoken word recognition. IEEE Transactions<br />
on Acoustics, Speech and Signal Processing 26:43—49, 1978.<br />
[4] D. Munroe, M. Madden, Multi-class and single-class<br />
classification approaches to vehicle Model recognition from<br />
images. Proceedings of IEEE AICS, 2005