Html - PUMA CATch up
Html - PUMA CATch up
Html - PUMA CATch up

You also want an ePaper? Increase the reach of your titles
YUMPU automatically turns print PDFs into web optimized ePapers that Google loves.
P : 116 | C : 2<br />
t.1<br />
inCome statement<br />
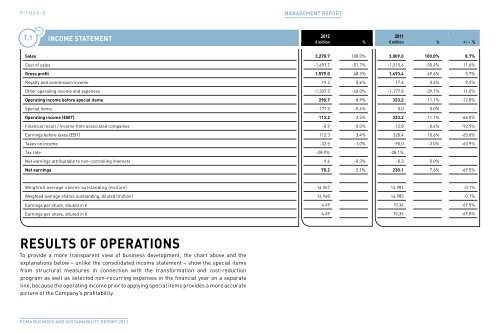
Results of oPeRations<br />
To provide a more transparent view of business development, the chart above and the<br />
explanations below – unlike the consolidated income statement – show the special items<br />
from structural measures in connection with the transformation and cost-reduction<br />
program as well as selected non-recurring expenses in the financial year on a separate<br />
line, because the operating income prior to applying special items provides a more accurate<br />
picture of the Company’s profitability.<br />
pUMa BUsiness and sUstainaBility RepoRt 2012<br />
ManageMent RepoRt<br />
2012 2011<br />
€ million % € million % + / – %<br />
sales 3,270.7 100.0% 3,009.0 100.0% 8.7%<br />
Cost of sales -1,691.7 -51.7% -1,515.6 -50.4% 11.6%<br />
Gross profit 1.579.0 48.3% 1,493.4 49.6% 5.7%<br />
Royalty and commission income 19.2 0,6% 17.6 0.6% 9.2%<br />
Other operating income and expenses -1,307.5 -40.0% -1,177.8 -39.1% 11.0%<br />
operating income before special items 290.7 8.9% 333.2 11.1% -12.8%<br />
Special items -177.5 -5.4% 0.0 0.0% -<br />
operating income (eBit) 113.2 3.5% 333.2 11.1% -66.0%<br />
Financial result / Income from associated companies -0.9 0.0% -12.8 -0.4% -92.9%<br />
Earnings before taxes (EBT) 112.3 3.4% 320.4 10.6% -65.0%<br />
Taxes on income -32.5 -1.0% -90.0 -3.0% -63.9%<br />
Tax rate -28.9% -28.1%<br />
Net earnings attributable to non-controlling interests -9.6 -0.3% -0.3 0.0%<br />
net earnings 70.2 2.1% 230.1 7.6% -69.5%<br />
Weighted average shares outstanding (million) 14.967 14.981 -0.1%<br />
Weighted average shares outstanding, diluted (million) 14.968 14.985 -0.1%<br />
Earnings per share, diluted in € 4.69 15.36 -69.5%<br />
Earnings per share, diluted in € 4.69 15,36 -69,5%