Html - PUMA CATch up
Html - PUMA CATch up
Html - PUMA CATch up

You also want an ePaper? Increase the reach of your titles
YUMPU automatically turns print PDFs into web optimized ePapers that Google loves.
p : 65 | c : 3 <strong>PUMA</strong>.SAfe<br />
For the first time ever in <strong>PUMA</strong>.Safe operations,<br />
the majority of our social monitoring<br />
activities focused<br />
on factories of<br />
<strong>PUMA</strong> licensees.<br />
Across all tiers<br />
and sourcing<br />
partners, 62 percent<br />
of all audited<br />
facilities globally<br />
were rated A or<br />
B+ while 16 per-<br />
B+ rating.<br />
cent of currently<br />
active facilities<br />
achieved C or D<br />
ratings and thus<br />
failed our audits.<br />
<strong>PUMA</strong> terminated its partnership with 29<br />
Tier1 facilities for non-compliance found<br />
in 2012. Forty-one facilities were assessed<br />
recurrently in line with our monitoring and<br />
remediation policies for facilities rated B-<br />
or lower. In 12 percent of these we found<br />
worse conditions during our follow-<strong>up</strong> visits<br />
despite our remediation efforts. Conditions<br />
in the other factories had improved.<br />
In 2015,<br />
90 percent of our<br />
s<strong>up</strong>pliers will<br />
achieve an A or<br />
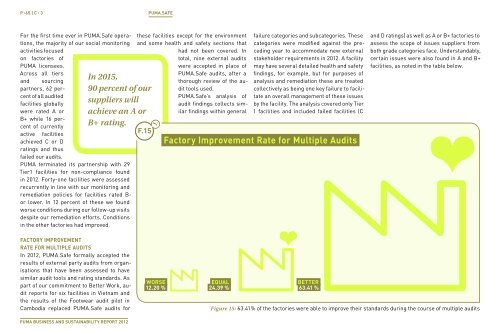
facTory improvemenT<br />
raTe for mulTiple audiTs<br />
In 2012, <strong>PUMA</strong>.Safe formally accepted the<br />
results of external party audits from organisations<br />
that have been assessed to have<br />
similar audit tools and rating standards. As<br />
part of our commitment to Better Work, audit<br />
reports for six facilities in Vietnam and<br />
the results of the Footwear audit pilot in<br />
Cambodia replaced <strong>PUMA</strong>.Safe audits for<br />
<strong>PUMA</strong> BUSineSS And SUStAinABility RePoRt 2012<br />
these facilities except for the environment<br />
and some health and safety sections that<br />
had not been covered. In<br />
total, nine external audits<br />
were accepted in place of<br />
<strong>PUMA</strong>.Safe audits, after a<br />
thorough review of the audit<br />
tools used.<br />
<strong>PUMA</strong>.Safe’s analysis of<br />
audit findings collects similar<br />
findings within general<br />
f.15<br />
t.1<br />
worse.<br />
12.20 %.<br />
eQual.<br />
24.39 %.<br />
failure categories and subcategories. These<br />
categories were modified against the preceding<br />
year to accommodate new external<br />
stakeholder requirements in 2012. A facility<br />
may have several detailed health and safety<br />
findings, for example, but for purposes of<br />
analysis and remediation these are treated<br />
collectively as being one key failure to facilitate<br />
an overall management of these issues<br />
by the facility. The analysis covered only Tier<br />
1 facilities and included failed facilities (C<br />
factory improvement rate for multiple audits<br />
BeTTer.<br />
63.41 %.<br />
and D ratings) as well as A or B+ factories to<br />
assess the scope of issues s<strong>up</strong>pliers from<br />
both grade categories face. Understandably,<br />
certain issues were also found in A and B+<br />
facilities, as noted in the table below.<br />
Figure 15: 63.41 % of the factories were able to improve their standards during the course of multiple audits