Html - PUMA CATch up
Html - PUMA CATch up
Html - PUMA CATch up

Create successful ePaper yourself
Turn your PDF publications into a flip-book with our unique Google optimized e-Paper software.
p : 183 | c :8<br />
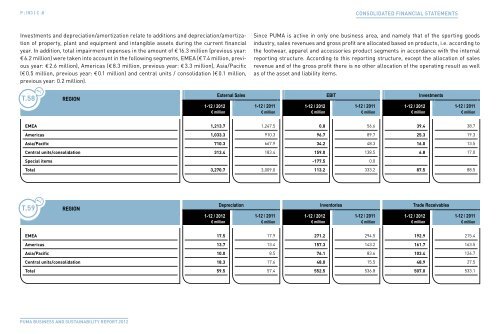
Investments and depreciation/amortization relate to additions and depreciation/amortization<br />
of property, plant and equipment and intangible assets during the current financial<br />
year. In addition, total impairment expenses in the amount of € 16.3 million (previous year:<br />
€ 6.2 million) were taken into account in the following segments, EMEA (€ 7.4 million, previous<br />
year: € 2.6 million), Americas (€ 8.3 million, previous year: € 3.3 million), Asia/Pacific<br />
(€ 0.5 million, previous year: € 0.1 million) and central units / consolidation (€ 0.1 million,<br />
previous year: 0.2 million).<br />
t.58 t.1<br />
regIon<br />
Since <strong>PUMA</strong> is active in only one business area, and namely that of the sporting goods<br />
industry, sales revenues and gross profit are allocated based on products, i.e. according to<br />
the footwear, apparel and accessories product segments in accordance with the internal<br />
reporting structure. According to this reporting structure, except the allocation of sales<br />
revenue and of the gross profit there is no other allocation of the operating result as well<br />
as of the asset and liability items.<br />
External Sales EBIT Investments<br />
1-12 / 2012 1-12 / 2011 1-12 / 2012 1-12 / 2011 1-12 / 2012 1-12 / 2011<br />
€ million € million € million € million € million € million<br />
emea 1,213.7 1,247.5 0.8 56.6 39.4 38.7<br />
americas 1,033.3 910.3 96.7 89.7 25.3 19.3<br />
asia/pacific 710.3 667.9 34.2 48.3 16.0 13.5<br />
central units/consolidation 313.4 183.4 159.0 138.5 6.8 17.0<br />
special items -177.5 0.0<br />
total 3,270.7 3,009.0 113.2 333.2 87.5 88.5<br />
t.59<br />
t.1<br />
regIon<br />
CONsOlidated FiNaNCial statemeNts<br />
Depreciation Inventories Trade Receivables<br />
1-12 / 2012 1-12 / 2011 1-12 / 2012 1-12 / 2011 1-12 / 2012 1-12 / 2011<br />
€ million € million € million € million € million € million<br />
emea 17.5 17.9 271.2 294.5 192.9 215.4<br />
americas 13.7 13.4 157.3 143.2 161.7 163.5<br />
asia/pacific 10.0 8.5 76.1 83.6 103.4 126.7<br />
central units/consolidation 18.3 17.6 48.0 15.5 48.9 27.5<br />
total 59.5 57.4 552.5 536.8 507.0 533.1<br />
<strong>PUMA</strong> BUsiness And sUstAinABility RePoRt 2012