Html - PUMA CATch up
Html - PUMA CATch up
Html - PUMA CATch up

You also want an ePaper? Increase the reach of your titles
YUMPU automatically turns print PDFs into web optimized ePapers that Google loves.
p : 164 | c :8<br />
lier years and the expected future business performance. Deferred tax assets on losses<br />
carried forward are recorded in the event of companies that incur a loss only if it is highly<br />
profitable that future positive income will be achieved that can be set off against these tax<br />
losses carried forward. Please see paragraph 8 for further information and detailed assumptions.<br />
DERIVATIVE FINANCIAL INSTRUMENTS The assumptions used for the estimation of derivative<br />
financial instruments are based on the prevailing market conditions as of the balance<br />
sheet date and thus reflect the fair value. See paragraph 24 for further information.<br />
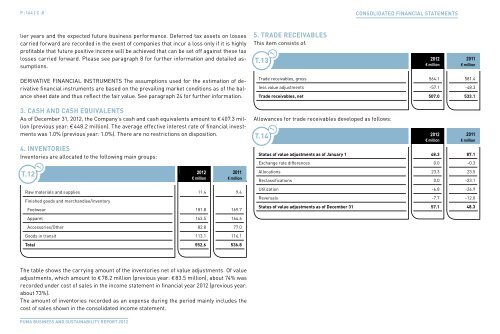
3. cash anD cash eQuIvalents<br />
As of December 31, 2012, the Company’s cash and cash equivalents amount to € 407.3 million<br />
(previous year: € 448.2 million). The average effective interest rate of financial investments<br />
was 1.0% (previous year: 1.0%). There are no restrictions on disposition.<br />
4. InventorIes<br />
Inventories are allocated to the following main gro<strong>up</strong>s:<br />
t.12 t.1<br />
2012 2011<br />
€ million € million<br />
Raw materials and s<strong>up</strong>plies<br />
Finished goods and merchandise/inventory<br />
11.4 9.4<br />
Footwear 181.8 169.7<br />
Apparel 163.5 164.6<br />
Accessories/Other 82.8 77.0<br />
Goods in transit 113.1 116.1<br />
total 552.6 536.8<br />
The table shows the carrying amount of the inventories net of value adjustments. Of value<br />
adjustments, which amount to € 78.2 million (previous year: € 83.5 million), about 74% was<br />
recorded under cost of sales in the income statement in financial year 2012 (previous year:<br />
about 73%).<br />
The amount of inventories recorded as an expense during the period mainly includes the<br />
cost of sales shown in the consolidated income statement.<br />
<strong>PUMA</strong> BUsiness And sUstAinABility RePoRt 2012<br />
5. traDe receIvables<br />
This item consists of:<br />
t.13 t.1<br />
2012 2011<br />
€ million € million<br />
Trade receivables, gross 564.1 581.4<br />
less value adjustments -57.1 -48.3<br />
trade receivables, net 507.0 533.1<br />
Allowances for trade receivables developed as follows:<br />
t.14<br />
t.1<br />
CONsOlidated FiNaNCial statemeNts<br />
2012 2011<br />
€ million € million<br />
status of value adjustments as of January 1 48.3 87.1<br />
Exchange rate differences 0.0 -0.3<br />
Allocations 23.3 23.5<br />
Reclassifications 0.0 -23.1<br />
Utilization -6.8 -26.9<br />
Reversals -7.7 -12.0<br />
status of value adjustments as of December 31 57.1 48.3