Html - PUMA CATch up
Html - PUMA CATch up
Html - PUMA CATch up

You also want an ePaper? Increase the reach of your titles
YUMPU automatically turns print PDFs into web optimized ePapers that Google loves.
p : 32 | C : 2<br />
<strong>PUMA</strong>Vision<br />
T.6 t.1<br />
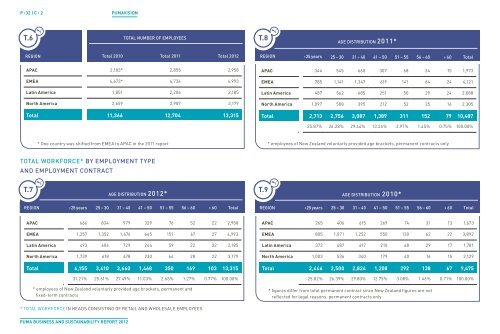
TOTAL NUMBER OF EMPLOYEES<br />
T.8 t.1<br />
REgiON<br />
<strong>PUMA</strong> BUsiness And sUstAinABility RePoRt 2012<br />
Total 2010 Total 2011 Total 2012<br />
apaC 2,183* 2,855 2,958<br />
EMEa 4,673* 4,736 4,993<br />
latin america 1,851 2,206 2,185<br />
North america 2,659 2,907 3,179<br />
Total 11,366 12,704 13,315<br />
TOTAL wORKFORCE* BY EMPLOYMENT TYPE<br />
AND EMPLOYMENT CONTRACT<br />
REgiON<br />
* One country was shifted from EMEA to APAC in the 2011 report<br />
T.7 t.1<br />
T.9 t.1<br />
AgE DiSTRiBUTiON 2012*<br />
‹ 25 years 25 – 30 31 – 40 41 – 50 51 – 55 56 – 60 › 60 Total<br />
apaC 666 834 979 329 76 52 22 2,958<br />
EMEa 1,257 1,352 1,474 665 151 67 27 4,993<br />
latin america 493 606 729 244 59 22 32 2,185<br />
North america 1,739 618 478 230 64 28 22 3,179<br />
Total 4,155 3,410 3,660 1,468 350 169 103 13,315<br />
31. 21 % 2 5.61 % 2 7. 49 % 11.0 3 % 2 .6 3 % 1. 2 7 % 0.7 7 % 100.00 %<br />
* employees of New Zealand voluntarly provided age brackets, permanent and<br />
fixed-term contracts<br />
* TOTAL WORKFORCE IN HEADS CONSISTING OF RETAIL AND WHOLESALE EMPLOYEES<br />
REgiON<br />
AgE DiSTRiBUTiON 2011*<br />
‹ 25 years 25 – 30 31 – 40 41 – 50 51 – 55 56 – 60 › 60 Total<br />
apaC 344 545 660 307 68 34 15 1,973<br />
EMEa 785 1,141 1,347 619 141 64 24 4,121<br />
latin america 487 562 685 251 50 29 24 2,088<br />
North america 1,097 508 395 212 52 25 16 2,305<br />
Total 2,713 2,756 3,087 1,389 311 152 79 10,487<br />
REgiON<br />
25.87 % 26. 2 8 % 2 9. 4 4 % 13. 2 4 % 2 .9 7 % 1. 4 5 % 0.7 5 % 100.00 %<br />
* employees of New Zealand voluntarly provided age brackets, permanent contracts only<br />
AgE DiSTRiBUTiON 2010*<br />
‹ 25 years 25 – 30 31 – 40 41 – 50 51 – 55 56 – 60 › 60 Total<br />
apaC 265 406 615 269 74 31 13 1,673<br />
EMEa 805 1,071 1,252 550 130 62 22 3,892<br />
latin america 373 487 617 210 48 29 17 1,781<br />
North america 1,003 536 340 179 40 16 15 2,129<br />
Total 2,446 2,500 2,824 1,208 292 138 67 9,475<br />
25.82 % 26.39 % 2 9. 8 0 % 12 .7 5 % 3.0 8 % 1. 4 6 % 0.71 % 100.00 %<br />
* figures differ from total permanent contract since New Zealand figures are not<br />
reflected for legal reasons, permanent contracts only