Html - PUMA CATch up
Html - PUMA CATch up
Html - PUMA CATch up

Create successful ePaper yourself
Turn your PDF publications into a flip-book with our unique Google optimized e-Paper software.
p : 124 | c : 2<br />
other assets<br />
Other current assets, which include the market value of financial derivatives, have<br />
decreased compared to the previous year by 70.7% to € 8.4 million. Other non-current<br />
assets, consisting mainly of intangible assets and property, plant and equipment, fell slightly<br />
by 3.0% to € 735.7 million. Other current liabilities dropped compared to the previous year<br />
by 16.5% to € 227.2 million, which was mainly caused by the decrease in tax liabilities. Other<br />
current liabilities mainly include the short-term portion of the restructuring provision,<br />
which also includes the liability to the former Spanish license holder Estudio 2000 S.A.<br />
These special items are the reason for the increase in current liabilities compared to the<br />
previous year by 55.3% to € 156.1 million.<br />
pUMa BUsiness and sUstainaBility RepoRt 2012<br />
ManageMent RepoRt<br />
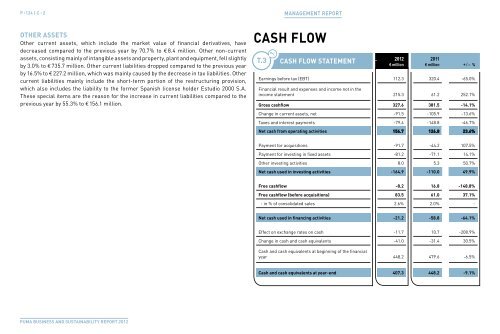
cash Flow<br />
t.3<br />
t.1<br />
cash Flow statement<br />
2012 2011<br />
€ million € million + / – %<br />
Earnings before tax (EBT) 112.3 320.4 -65.0%<br />
Financial result and expenses and income not in the<br />
income statement 215.3 61.2 252.1%<br />
gross cashflow 327.6 381.5 -14.1%<br />
Change in current assets, net -91.5 -105.9 -13.6%<br />
Taxes and interest payments -79.4 -148.8 -46.7%<br />
net cash from operating activities 156.7 126.8 23.6%<br />
Payment for acquisitions -91.7 -44.2 107.5%<br />
Payment for investing in fixed assets -81.2 -71.1 14.1%<br />
Other investing activities 8.0 5.3 50.7%<br />
net cash used in investing activities -164.9 -110.0 49.9%<br />
Free cashflow -8.2 16.8 -148.8%<br />
Free cashflow (before acquisitions) 83.5 61.0 37.1%<br />
- in % of consolidated sales 2.6% 2.0% -<br />
net cash used in financing activities -21.2 -58.8 -64.1%<br />
Effect on exchange rates on cash -11.7 10.7 -208.9%<br />
Change in cash and cash equivalents -41.0 -31.4 30.5%<br />
Cash and cash equivalents at beginning of the financial<br />
year 448.2 479.6 -6.5%<br />
cash and cash equivalents at year-end 407.3 448.2 -9.1%