Html - PUMA CATch up
Html - PUMA CATch up
Html - PUMA CATch up

Create successful ePaper yourself
Turn your PDF publications into a flip-book with our unique Google optimized e-Paper software.
p : 175 | c :8<br />
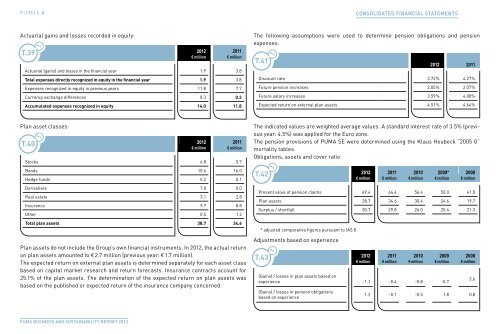
Actuarial gains and losses recorded in equity:<br />
t.39 t.1<br />
Plan asset classes:<br />
2012 2011<br />
€ million € million<br />
Actuarial (gains) and losses in the financial year 1.9 3.8<br />
total expenses directly recognized in equity in the financial year 1.9 3.8<br />
Expenses recognized in equity in previous years 11.8 7.7<br />
Currency exchange differences 0.3 0.3<br />
accumulated expenses recognized in equity 14.0 11.8<br />
t.40 t.1<br />
2012 2011<br />
€ million € million<br />
Stocks 6.8 5.7<br />
Bonds 10.6 16.0<br />
Hedge funds 0.2 0.1<br />
Derivatives 7.8 0.0<br />
Real estate 3.1 2.8<br />
Insurance 9.7 8.8<br />
Other 0.5 1.2<br />
total plan assets 38.7 34.6<br />
Plan assets do not include the Gro<strong>up</strong>’s own financial instruments. In 2012, the actual return<br />
on plan assets amounted to € 2.7 million (previous year: € 1.7 million).<br />
The expected return on external plan assets is determined separately for each asset class<br />
based on capital market research and return forecasts. Insurance contracts account for<br />
25.1% of the plan assets. The determination of the expected return on plan assets was<br />
based on the published or expected return of the insurance company concerned.<br />
<strong>PUMA</strong> BUsiness And sUstAinABility RePoRt 2012<br />
The following assumptions were used to determine pension obligations and pension<br />
expenses:<br />
t.41 t.1<br />
2012 2011<br />
Discount rate 3.72 % 4.27 %<br />
Future pension increases 2.05 % 2.07 %<br />
Future salary increases 3.59 % 4.08 %<br />
Expected return on external plan assets 4.51 % 4.64 %<br />
The indicated values are weighted average values. A standard interest rate of 3.5% (previous<br />
year: 4.5%) was applied for the Euro zone.<br />
The pension provisions of <strong>PUMA</strong> SE were determined using the Klaus Heubeck “2005 G”<br />
mortality tables.<br />
Obligations, assets and cover ratio<br />
t.42 t.1<br />
2012 2011 2010 2009* 2008<br />
€ million € million € million € million € million<br />
Present value of pension claims 69.4 64.4 56.4 50.0 41.0<br />
Plan assets 38.7 34.6 30.4 24.6 19.7<br />
Surplus / shortfall 30.7 29.8 26.0 25.4 21.3<br />
* adjusted comparative figures pursuant to IAS 8<br />
Adjustments based on experience<br />
t.43<br />
t.1<br />
2012 2011 2010 2009 2008<br />
€ million € million € million € million € million<br />
(Gains) / losses in plan assets based on<br />
experience -1.1 -0.4 -0.8 -0.7<br />
(Gains) / losses in pension obligations<br />
based on experience<br />
CONsOlidated FiNaNCial statemeNts<br />
2.6<br />
1.2 -0.1 -0.5 1.8 0.8