Conducting a Participatory Situation Analysis of.pdf - Global HIV ...
Conducting a Participatory Situation Analysis of.pdf - Global HIV ...
Conducting a Participatory Situation Analysis of.pdf - Global HIV ...

You also want an ePaper? Increase the reach of your titles
YUMPU automatically turns print PDFs into web optimized ePapers that Google loves.
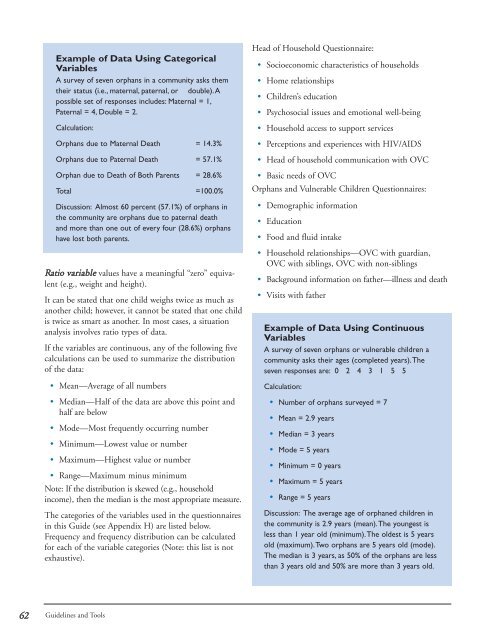
Example <strong>of</strong> Data Using Categorical<br />
Variables<br />
A survey <strong>of</strong> seven orphans in a community asks them<br />
their status (i.e., maternal, paternal, or double).A<br />
possible set <strong>of</strong> responses includes: Maternal = 1,<br />
Paternal = 4, Double = 2.<br />
Calculation:<br />
Orphans due to Maternal Death = 14.3%<br />
Orphans due to Paternal Death = 57.1%<br />
Orphan due to Death <strong>of</strong> Both Parents = 28.6%<br />
Total =100.0%<br />
Discussion: Almost 60 percent (57.1%) <strong>of</strong> orphans in<br />
the community are orphans due to paternal death<br />
and more than one out <strong>of</strong> every four (28.6%) orphans<br />
have lost both parents.<br />
Ratio variable values have a meaningful “zero” equivalent<br />
(e.g., weight and height).<br />
It can be stated that one child weighs twice as much as<br />
another child; however, it cannot be stated that one child<br />
is twice as smart as another. In most cases, a situation<br />
analysis involves ratio types <strong>of</strong> data.<br />
If the variables are continuous, any <strong>of</strong> the following five<br />
calculations can be used to summarize the distribution<br />
<strong>of</strong> the data:<br />
• Mean—Average <strong>of</strong> all numbers<br />
• Median—Half <strong>of</strong> the data are above this point and<br />
half are below<br />
• Mode—Most frequently occurring number<br />
• Minimum—Lowest value or number<br />
• Maximum—Highest value or number<br />
• Range—Maximum minus minimum<br />
Note: If the distribution is skewed (e.g., household<br />
income), then the median is the most appropriate measure.<br />
The categories <strong>of</strong> the variables used in the questionnaires<br />
in this Guide (see Appendix H) are listed below.<br />
Frequency and frequency distribution can be calculated<br />
for each <strong>of</strong> the variable categories (Note: this list is not<br />
exhaustive).<br />
Head <strong>of</strong> Household Questionnaire:<br />
• Socioeconomic characteristics <strong>of</strong> households<br />
• Home relationships<br />
• Children’s education<br />
• Psychosocial issues and emotional well-being<br />
• Household access to support services<br />
• Perceptions and experiences with <strong>HIV</strong>/AIDS<br />
• Head <strong>of</strong> household communication with OVC<br />
• Basic needs <strong>of</strong> OVC<br />
Orphans and Vulnerable Children Questionnaires:<br />
• Demographic information<br />
• Education<br />
• Food and fluid intake<br />
• Household relationships—OVC with guardian,<br />
OVC with siblings, OVC with non-siblings<br />
• Background information on father—illness and death<br />
• Visits with father<br />
Example <strong>of</strong> Data Using Continuous<br />
Variables<br />
A survey <strong>of</strong> seven orphans or vulnerable children a<br />
community asks their ages (completed years).The<br />
seven responses are: 0 2 4 3 1 5 5<br />
Calculation:<br />
• Number <strong>of</strong> orphans surveyed = 7<br />
• Mean = 2.9 years<br />
• Median = 3 years<br />
• Mode = 5 years<br />
• Minimum = 0 years<br />
• Maximum = 5 years<br />
• Range = 5 years<br />
Discussion: The average age <strong>of</strong> orphaned children in<br />
the community is 2.9 years (mean).The youngest is<br />
less than 1 year old (minimum).The oldest is 5 years<br />
old (maximum).Two orphans are 5 years old (mode).<br />
The median is 3 years, as 50% <strong>of</strong> the orphans are less<br />
than 3 years old and 50% are more than 3 years old.<br />
62<br />
Guidelines and Tools