Conducting a Participatory Situation Analysis of.pdf - Global HIV ...
Conducting a Participatory Situation Analysis of.pdf - Global HIV ...
Conducting a Participatory Situation Analysis of.pdf - Global HIV ...

Create successful ePaper yourself
Turn your PDF publications into a flip-book with our unique Google optimized e-Paper software.
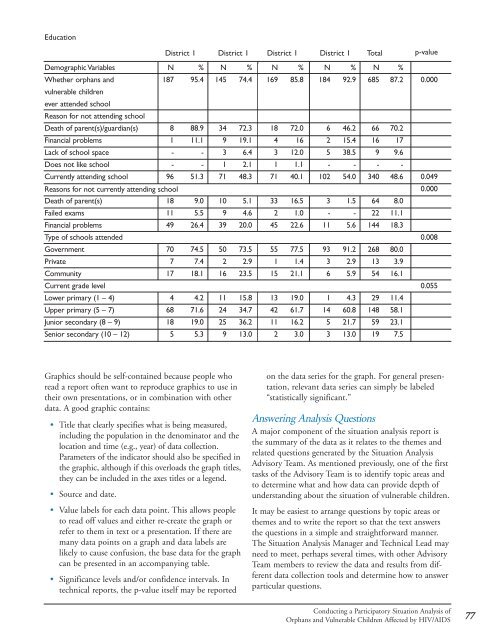
Education<br />
District 1 District 1 District 1 District 1 Total<br />
p-value<br />
Demographic Variables<br />
N<br />
%<br />
N<br />
%<br />
N<br />
%<br />
N<br />
%<br />
N<br />
%<br />
Whether orphans and<br />
187<br />
95.4<br />
145<br />
74.4<br />
169<br />
85.8<br />
184<br />
92.9<br />
685<br />
87.2<br />
0.000<br />
vulnerable children<br />
ever attended school<br />
Reason for not attending school<br />
Death <strong>of</strong> parent(s)/guardian(s)<br />
8<br />
88.9<br />
34<br />
72.3<br />
18<br />
72.0<br />
6<br />
46.2<br />
66<br />
70.2<br />
Financial problems<br />
1<br />
11.1<br />
9<br />
19.1<br />
4<br />
16<br />
2<br />
15.4<br />
16<br />
17<br />
Lack <strong>of</strong> school space<br />
-<br />
-<br />
3<br />
6.4<br />
3<br />
12.0<br />
5<br />
38.5<br />
9<br />
9.6<br />
Does not like school<br />
-<br />
-<br />
1<br />
2.1<br />
1<br />
1.1<br />
-<br />
-<br />
-<br />
-<br />
Currently attending school<br />
96<br />
51.3<br />
71<br />
48.3<br />
71<br />
40.1<br />
102<br />
54.0<br />
340<br />
48.6<br />
0.049<br />
Reasons for not currently attending school<br />
0.000<br />
Death <strong>of</strong> parent(s)<br />
18<br />
9.0<br />
10<br />
5.1<br />
33<br />
16.5<br />
3<br />
1.5<br />
64<br />
8.0<br />
Failed exams<br />
11<br />
5.5<br />
9<br />
4.6<br />
2<br />
1.0<br />
-<br />
-<br />
22<br />
11.1<br />
Financial problems<br />
49<br />
26.4<br />
39<br />
20.0<br />
45<br />
22.6<br />
11<br />
5.6<br />
144<br />
18.3<br />
Type <strong>of</strong> schools attended<br />
0.008<br />
Government<br />
70<br />
74.5<br />
50<br />
73.5<br />
55<br />
77.5<br />
93<br />
91.2<br />
268<br />
80.0<br />
Private<br />
7<br />
7.4<br />
2<br />
2.9<br />
1<br />
1.4<br />
3<br />
2.9<br />
13<br />
3.9<br />
Community<br />
17<br />
18.1<br />
16<br />
23.5<br />
15<br />
21.1<br />
6<br />
5.9<br />
54<br />
16.1<br />
Current grade level<br />
0.055<br />
Lower primary (1 – 4)<br />
4<br />
4.2<br />
11<br />
15.8<br />
13<br />
19.0<br />
1<br />
4.3<br />
29<br />
11.4<br />
Upper primary (5 – 7)<br />
68<br />
71.6<br />
24<br />
34.7<br />
42<br />
61.7<br />
14<br />
60.8<br />
148<br />
58.1<br />
Junior secondary (8 – 9)<br />
18<br />
19.0<br />
25<br />
36.2<br />
11<br />
16.2<br />
5<br />
21.7<br />
59<br />
23.1<br />
Senior secondary (10 – 12)<br />
5<br />
5.3<br />
9<br />
13.0<br />
2<br />
3.0<br />
3<br />
13.0<br />
19<br />
7.5<br />
Graphics should be self-contained because people who<br />
read a report <strong>of</strong>ten want to reproduce graphics to use in<br />
their own presentations, or in combination with other<br />
data. A good graphic contains:<br />
• Title that clearly specifies what is being measured,<br />
including the population in the denominator and the<br />
location and time (e.g., year) <strong>of</strong> data collection.<br />
Parameters <strong>of</strong> the indicator should also be specified in<br />
the graphic, although if this overloads the graph titles,<br />
they can be included in the axes titles or a legend.<br />
• Source and date.<br />
• Value labels for each data point. This allows people<br />
to read <strong>of</strong>f values and either re-create the graph or<br />
refer to them in text or a presentation. If there are<br />
many data points on a graph and data labels are<br />
likely to cause confusion, the base data for the graph<br />
can be presented in an accompanying table.<br />
• Significance levels and/or confidence intervals. In<br />
technical reports, the p-value itself may be reported<br />
on the data series for the graph. For general presentation,<br />
relevant data series can simply be labeled<br />
“statistically significant.”<br />
Answering <strong>Analysis</strong> Questions<br />
A major component <strong>of</strong> the situation analysis report is<br />
the summary <strong>of</strong> the data as it relates to the themes and<br />
related questions generated by the <strong>Situation</strong> <strong>Analysis</strong><br />
Advisory Team. As mentioned previously, one <strong>of</strong> the first<br />
tasks <strong>of</strong> the Advisory Team is to identify topic areas and<br />
to determine what and how data can provide depth <strong>of</strong><br />
understanding about the situation <strong>of</strong> vulnerable children.<br />
It may be easiest to arrange questions by topic areas or<br />
themes and to write the report so that the text answers<br />
the questions in a simple and straightforward manner.<br />
The <strong>Situation</strong> <strong>Analysis</strong> Manager and Technical Lead may<br />
need to meet, perhaps several times, with other Advisory<br />
Team members to review the data and results from different<br />
data collection tools and determine how to answer<br />
particular questions.<br />
<strong>Conducting</strong> a <strong>Participatory</strong> <strong>Situation</strong> <strong>Analysis</strong> <strong>of</strong><br />
Orphans and Vulnerable Children Affected by <strong>HIV</strong>/AIDS<br />
77