Entire Document - Chris Hani District Municipality
Entire Document - Chris Hani District Municipality
Entire Document - Chris Hani District Municipality

You also want an ePaper? Increase the reach of your titles
YUMPU automatically turns print PDFs into web optimized ePapers that Google loves.
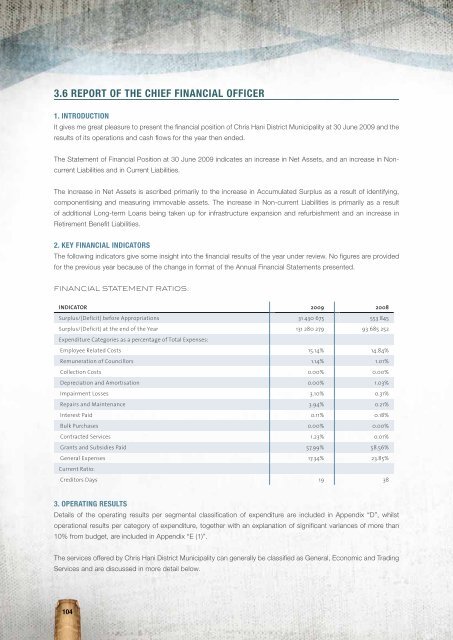
3.6 REPORT OF THE CHIEF FINANCIAL OFFICER<br />
1. INTRODUCTION<br />
It gives me great pleasure to present the financial position of <strong>Chris</strong> <strong>Hani</strong> <strong>District</strong> <strong>Municipality</strong> at 30 June 2009 and the<br />
results of its operations and cash flows for the year then ended.<br />
The Statement of Financial Position at 30 June 2009 indicates an increase in Net Assets, and an increase in Noncurrent<br />
Liabilities and in Current Liabilities.<br />
The increase in Net Assets is ascribed primarily to the increase in Accumulated Surplus as a result of identifying,<br />
componentising and measuring immovable assets. The increase in Non-current Liabilities is primarily as a result<br />
of additional Long-term Loans being taken up for infrastructure expansion and refurbishment and an increase in<br />
Retirement Benefit Liabilities.<br />
2. KEY FINANCIAL INDICATORS<br />
The following indicators give some insight into the financial results of the year under review. No figures are provided<br />
for the previous year because of the change in format of the Annual Financial Statements presented.<br />
Financial Statement Ratios:<br />
INDICATOR 2009 2008<br />
Surplus/(Deficit) before Appropriations 31 430 675 553 845<br />
Surplus/(Deficit) at the end of the Year 131 280 279 93 685 252<br />
Expenditure Categories as a percentage of Total Expenses:<br />
Employee Related Costs 15.14% 14.84%<br />
Remuneration of Councillors 1.14% 1.01%<br />
Collection Costs 0.00% 0.00%<br />
Depreciation and Amortisation 0.00% 1.03%<br />
Impairment Losses 3.10% 0.31%<br />
Repairs and Maintenance 3.94% 0.21%<br />
Interest Paid 0.11% 0.18%<br />
Bulk Purchases 0.00% 0.00%<br />
Contracted Services 1.23% 0.01%<br />
Grants and Subsidies Paid 57.99% 58.56%<br />
General Expenses 17.34% 23.85%<br />
Current Ratio:<br />
Creditors Days 19 38<br />
3. OPERATING RESULTS<br />
Details of the operating results per segmental classification of expenditure are included in Appendix “D”, whilst<br />
operational results per category of expenditure, together with an explanation of significant variances of more than<br />
10% from budget, are included in Appendix “E (1)”.<br />
The services offered by <strong>Chris</strong> <strong>Hani</strong> <strong>District</strong> <strong>Municipality</strong> can generally be classified as General, Economic and Trading<br />
Services and are discussed in more detail below.<br />
104